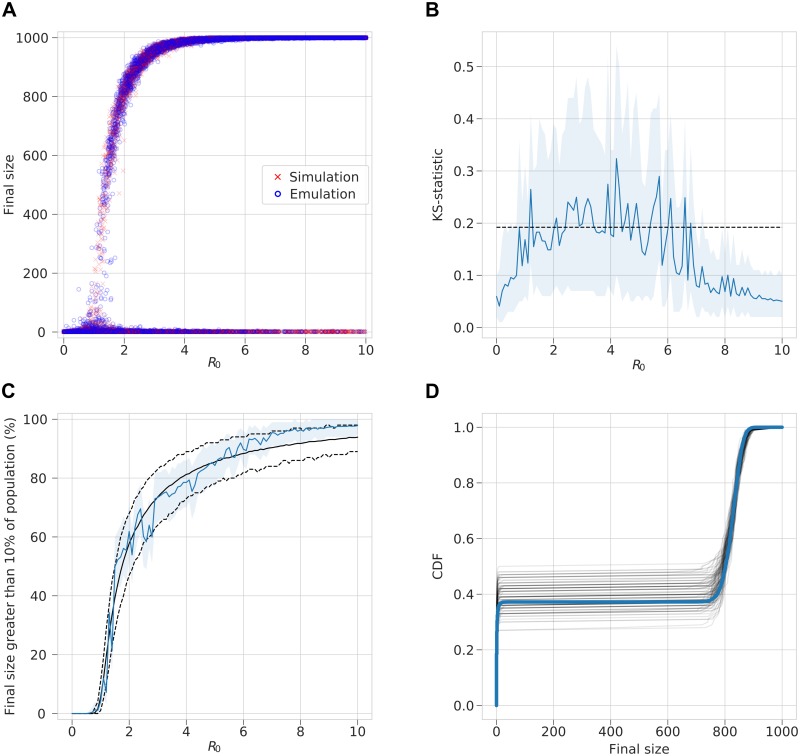
Fig 3. Binomial-MDN output emulating the final size distribution of a stochastic SIR model.
(A) For random uniform sampling over β and γ a sample of the output from MDN across values for the basic reproductive number R0 = β/γ are shown in blue and the directly simulated values are shown in red. (B) Corresponding two-sample K–S statistic where sample of 100 points are drawn from a negative binomial and the MDN over a range of R0 values. 100 replicates are used to estimate a mean K–S statistic and a 95% range. Dashed line represent significance at α = 0.05, with values less indicating the two samples do not differ significantly. (C) The percentage of 1,000 realisations of the stochastic SIR model with final size greater than 100 is shown in black with dashed line showing a 95% range. Emulated results are shown by the blue line with a 95% range. (D) Example empirical CDFs drawn from 100 samples of MDN with inputs β = 0.4 and γ = 0.2. 1,000 empirical CDF are shown as black transparent lines and true CDF is shown as a blue solid line.

