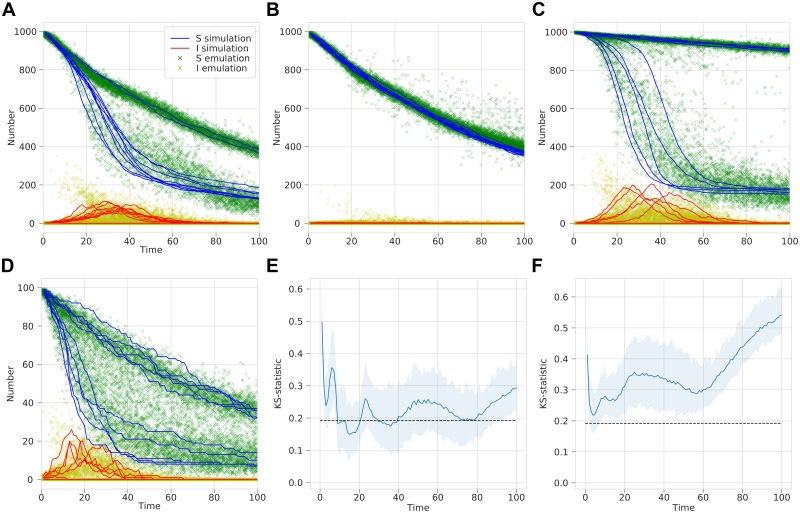
Fig 5. Beta-MDN output emulating the infection dynamics with time for a stochastic SIR model.
(A–D) A comparison of simulation results with sampled MDN output for fixed γ = 0.2 and different β, δ and N values such that (A) R0 = 2.0, δ = 0.01 and N = 1, 000, (B) R0 = 1.0, δ = 0.01 and N = 1, 000, (C) R0 = 2.0, δ = 0.001 and N = 1, 000, (D) R0 = 2.0, δ = 0.01 and N = 100. (E–F) Two-sample K–S statistic where sample of 100 points are drawn from a negative binomial and the MDN over a range of time t values. 100 replicates are used to estimate a mean K–S statistic and a 95% range. Dashed line represent significance at α = 0.05, with values less indicating the two samples do not differ significantly. Tests are for (E) number of susceptible people and (F) number of infected people.

