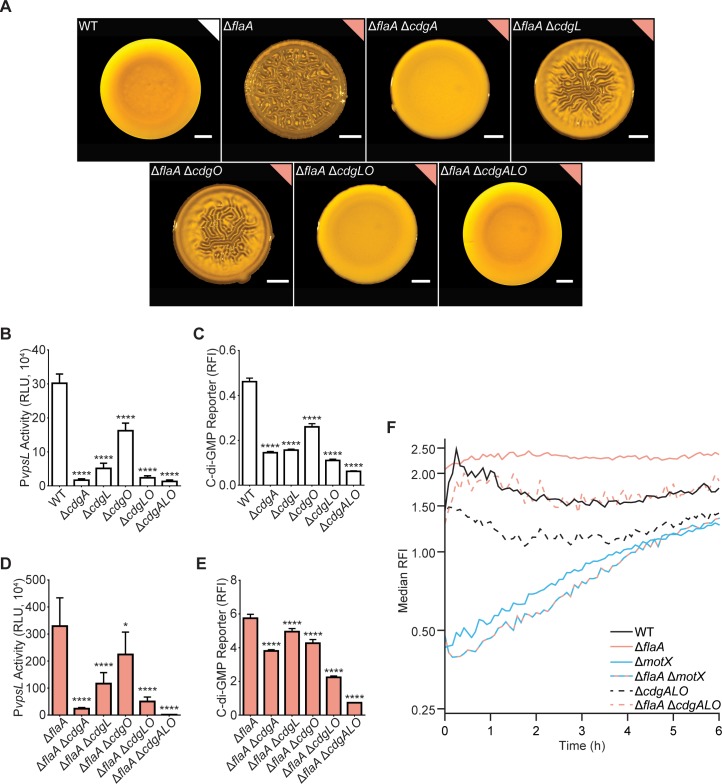
Fig 6. Three DGCs are required for the FDBR response in the ΔflaA strain.
A) Representative images of the colony morphologies of indicated strains. Scale bars = 1 mm. B) Bar graph of means and standard deviations of RLU obtained from the transcription of vpsL-luxCDABE in colonies of indicated strains. C) Bar graph of means and standard deviations of RFI obtained from the expression of the c-di-GMP biosensor in indicated strains. D) Bar graph of means and standard deviations of RLU obtained from the transcription of vpsL-luxCADBE in colonies of indicated strains. E) Bar graph of means and standard deviations of RFI obtained from the expression of the c-di-GMP biosensor in indicated strains. F) Plots of the median RFI for ΔcdgALO and ΔflaA ΔcdgALO cells on the surface in flow cells. Data from the WT, ΔflaA, ΔmotX, and ΔflaA ΔmotX strains are the same as in Fig 5. Flow cell experiments from Fig 5 and Fig 6 were done in parallel and separated for clarity. For each time point and strain, the distribution of RFI values were obtained from 2 independent experiments, and the median was calculated from these distributions. Time t = 0 h corresponds to when image acquisition began after flow started, not inoculation time for a more unbiased comparison of surface attached cells between strains with and without attachment defects. Error estimates for these RFI values, in the form of 95% confidence intervals, are shown in supplementary S1 Fig. Means were compared to WT or ΔflaA with a one-way ANOVA followed by Dunnett’s multiple-comparison test. Adjusted P values ≤ 0.05 were deemed significant. * p ≤ 0.05; **** p ≤ 0.0001. Experiments were done on 3 biological replicates.

