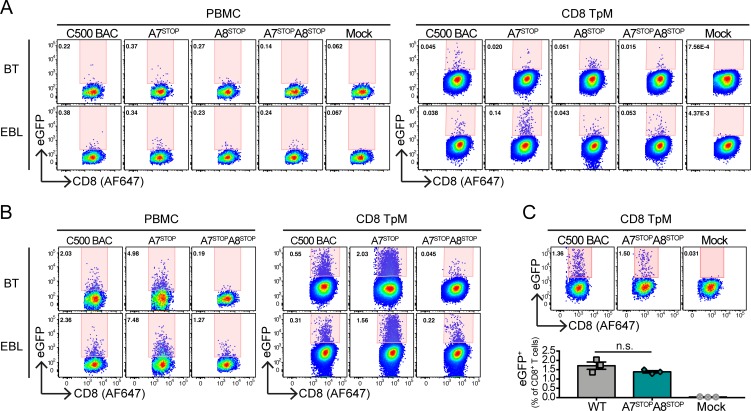
Fig 10. Ex vivo infection of bovine CD8+ T lymphocytes by co-culture with infected BT or EBL cell.
(A and B) Pseudocolour contour plots showing the percentages of eGFP+ cells in gated CD8+ T lymphocytes (PBMCs or CD8TpM cell line) by flow cytometry after 48h co-culture with BT or EBL infected with C500 BAC+ WT, BAC+ A7STOP, BAC+ A8STOP or BAC+ A7STOPA8STOP viruses (A = m.o.i. = 0.01; B = m.o.i. = 0.1). (C) Representative pseudocolour contour plots of CD8TpM cells showing the percentages of eGFP+ cells after co-culture with EBL infected with C500 BAC+ WT or BAC+ A7STOPA8STOP virus. Bars show mean ±SD (n = 3). One-way ANOVA with Dunnet’s post-hoc test was used to identify significant differences (n.s. = not significant).

