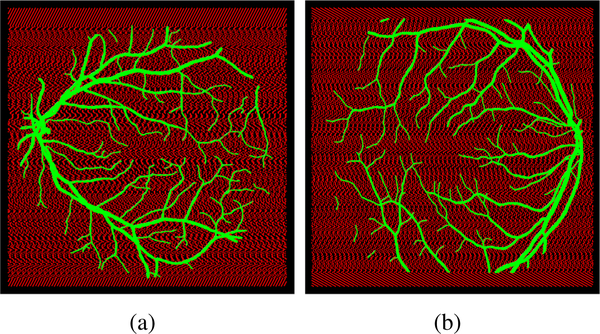
Fig. 3.
Visualization of the trained patches, green dots represent positive cases, red dots represent negative cases: (a) image with id#01 in DRIVE dataset superimposed on the corresponding GT with overlapping foreground pixels equal to 24658 and background patches equal to 27964 with stride equal to 12 instead of 77059 when stride equal 1, (b) image number id#82 in the STARE data set superimposed on the GT with overlapping foreground pixels equal to 33310 and background patches equal to 35710 with stride equal to 12 instead of 392804 with overlapping patches

