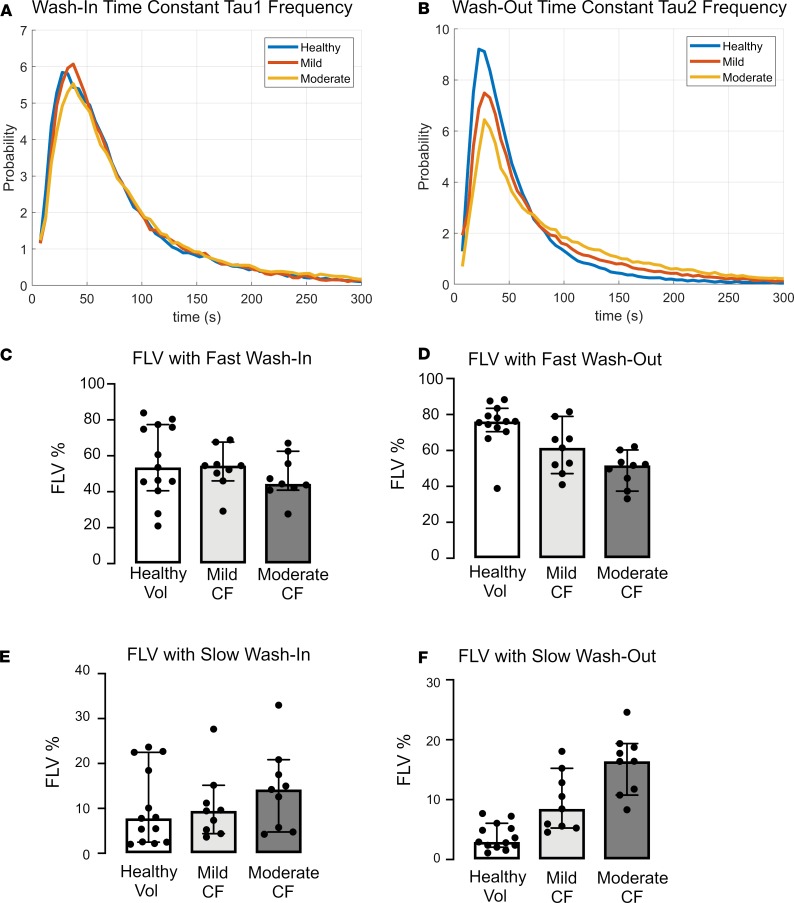
Figure 2. Ventilation Kinetics Analysis.
(A and B) Histograms of wash-in (A) and wash-out (B) time constants for healthy controls, mild CF subjects, and moderate CF subjects. (C–F) Scatter and box plots (median ± 95% CI) demonstrating FLV of fast wash-in (C), fast wash-out (D), slow wash-in (E), and slow washout (F). ANOVA. Tukey’s honest significance test (HSD) was performed for multiple between-group comparisons. Slow emptying fraction: healthy vs. mild CF, P = 0.007; mild CF vs. mod CF, P = 0.006. Fast emptying fraction: healthy vs. mild CF, P = 0.04; mild vs. moderate CF, P = 0.13).

