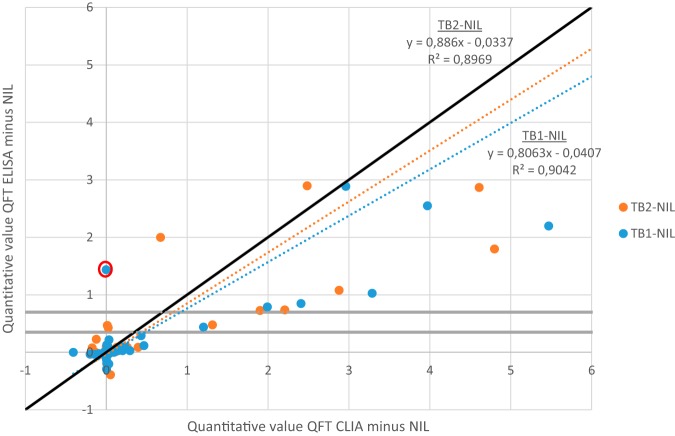
FIG 1.
Quantitative comparison of ‘TB1 minus NIL’ and ‘TB2 minus NIL’ with QFT ELISA and QFT CLIA (values above 6 are not shown). The gray lines indicate the proposed ELISA-based borderline range. The result circled in red is sample 5 of Table 1 (indeterminate with QFT CLIA).

