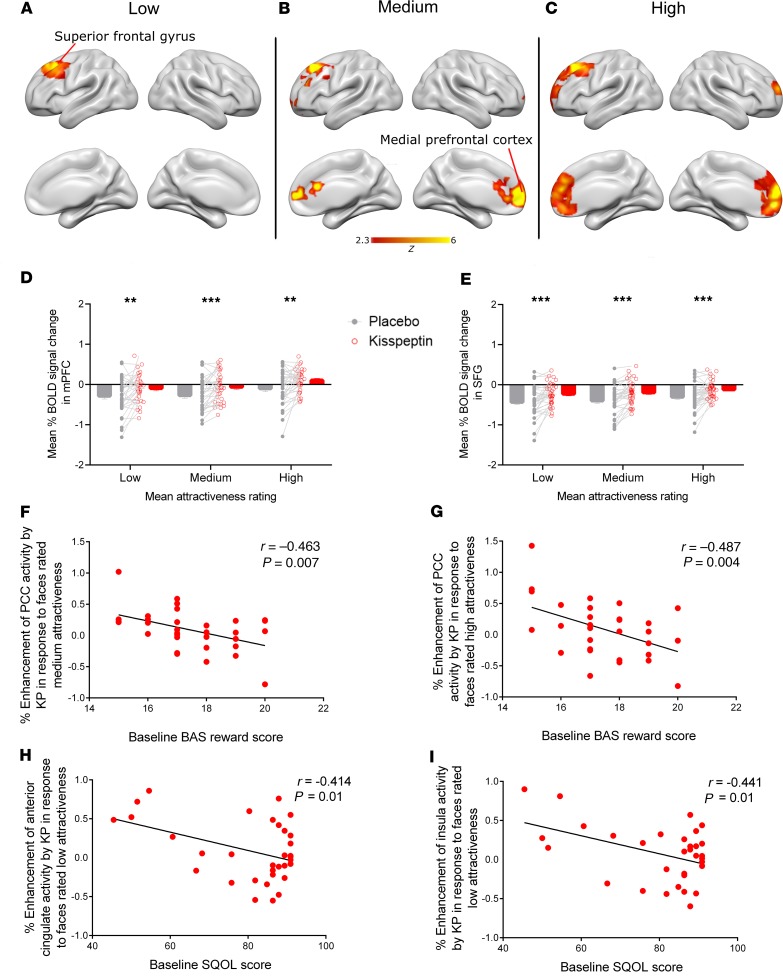
Figure 3. Facial attractiveness task.
(A–C) Whole-brain analysis of kisspeptin-enhanced BOLD activity in response to faces rated (A) low, (B) medium, and (C) high attractiveness (n = 33). (D) Mean percentage of BOLD signal change in the functionally defined ROI. mPFC, low: t(32) = 2.804, P = 0.009; medium: t(32) = 4, P < 0.001; high: t(32) = 3.066, P = 0.004. (E) Mean percentage of BOLD signal change in the functionally defined ROI. SFG, low: t(32) = 3 .966, P < 0.001; medium: t(32) = 4.567, P < 0.001; high: t(32) = 3.668, P < 0.001. (**P < 0.01, and ***P < 0.001, paired 2-tailed t test.) (F and G) Pearson’s correlation between BAS reward score and PCC enhancement by kisspeptin in response to faces rated (F) medium (r = –0.463, and P = 0.007) and (G) high (r = –0.487, and P = 0.004) attractiveness. (H and I) Pearson’s correlation between sexual quality-of-life (SQOL) score and enhancement of (H) ACC (r = –0.414, and P = 0.01) and (I) insula (r = –0.441, and P = 0.01) activity by kisspeptin in response to faces of low attractiveness (n = 33).

