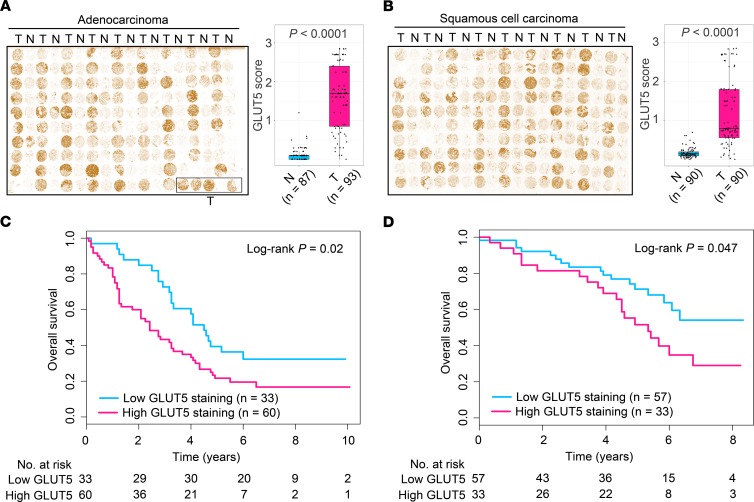
Figure 3. Increased GLUT5 expression in LC tissues is validated in 2 independent patient cohorts.
(A and B) IHC staining of lung tissue microarrays using GLUT5 antibody for patients with lung ADC (A) or SCC (B). N, paired adjacent normal lung tissues; T, tumorous lung tissues. The midline represents the median of the data, with the upper and lower limits of the box being the third and first quartiles. Additionally, the whiskers of the box plot extend up to 1.5 times the interquartile range from the top or bottom of the box. P values were calculated using 2-tailed Wilcoxon’s rank-sum test. (C and D) Overall survival curves of patients with lung ADC (C) or lung SCC (D) stratified by low and high GLUT5. GLUT5 expression in LC tissues was measured by IHC staining. P values were computed using log-rank test.

