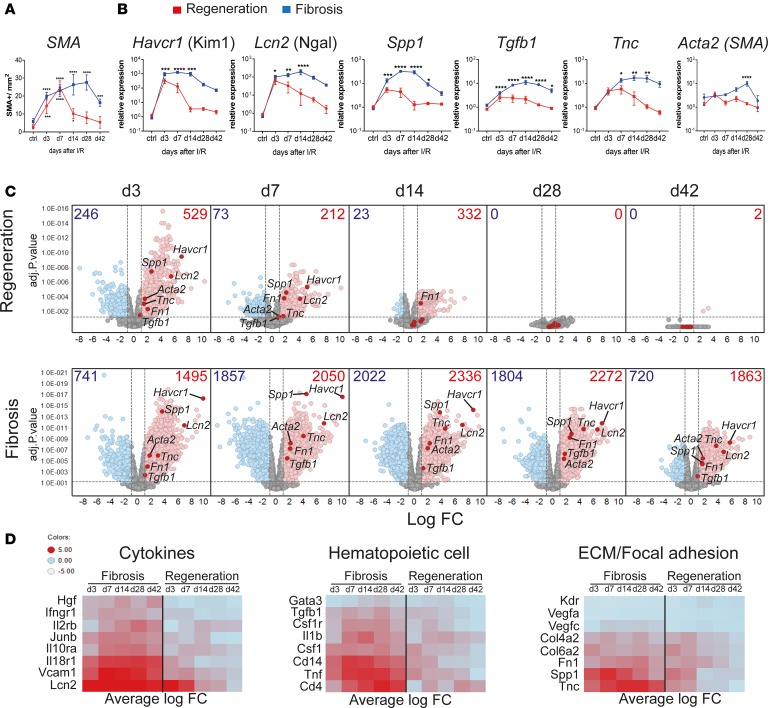
Figure 1. Kidney regeneration and fibrosis characterization after ischemia/reperfusion injury (IRI) reveal sustained dysregulation in immune system–related pathways during kidney fibrosis.
Time course after kidney injury in regeneration and fibrosis models. Mice were subjected to 30 minutes of unilateral left renal IRI, with (regeneration) or without contralateral kidney nephrectomy (fibrosis). (A) Morphometric quantification of α-smooth muscle actin (SMA) staining on kidney sections at indicated time points from regeneration (red line) and fibrosis (blue line). (B) qPCR analysis of the indicated genes, on regeneration (red line) and fibrosis (blue line) samples for the indicated time points, as fold change relative to control samples. (C) Volcano plots showing the fold change (FC) versus P value of differentially expressed (DE) genes in regeneration (top) and fibrosis (bottom) for the indicated time points (in days), compared with age- and sex-matched naive and sham control mice. Numbers indicate upregulated (red) FC > 2, or downregulated genes (blue) FC < 2; P < 0.05. Selected kidney injury and fibrosis biomarker genes are highlighted. (D) Heatmaps showing the average FC of selected upregulated genes from key regulated pathways. Results are representative of 1 (regeneration model) or 2 (fibrosis model) independent experiments, with 3 to 5 mice per time point/condition. Mean ± SEM. *P < 0.05; **P < 0.01; ***P < 0.001; ****P < 0.0001 compared with controls by 2-way ANOVA followed by Dunnett’s post hoc test for multiple comparisons (A and B).

