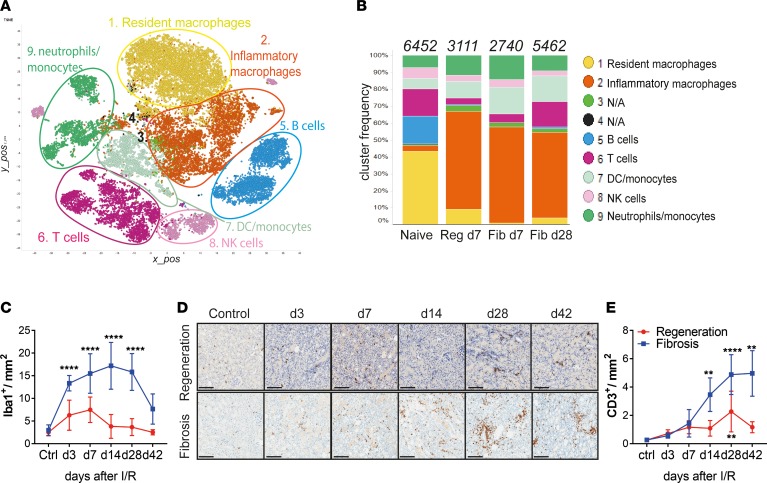
Figure 2. Single-cell RNA-Seq reveals major alterations in tissue-resident myeloid and T cells after kidney injury.
(A) Unsupervised clustering showing 9 major clusters in 2-dimensional t-SNE plots. A total of 28,767 combined CD45+ single cells from naive, regeneration day 7, and fibrosis days 7 and 28, derived from 2 independent biological replicates each. (B) Bar graphs showing the relative frequencies of the respective clusters from A, in each disease model from indicated time points. Numbers on top indicate the total number of cells per condition analyzed. (C) Morphometric quantification of Iba-1+ macrophage immunostaining on kidney sections from regeneration and fibrosis. (D) Representative CD3 immunostaining on kidney sections from regeneration (top) and fibrosis (bottom) for the indicated time points and (E) morphometric quantification. Scale bars: 100 μm. Results are representative of 1 (regeneration model) or 2 (fibrosis model) independent experiments, with 3 to 5 mice per time point/condition. Mean ± SEM. **P < 0.01; ****P < 0.0001 compared with controls by 2-way ANOVA followed by Dunnett’s post hoc test for multiple comparisons (E and F). Reg, regeneration; Fib, fibrosis.

