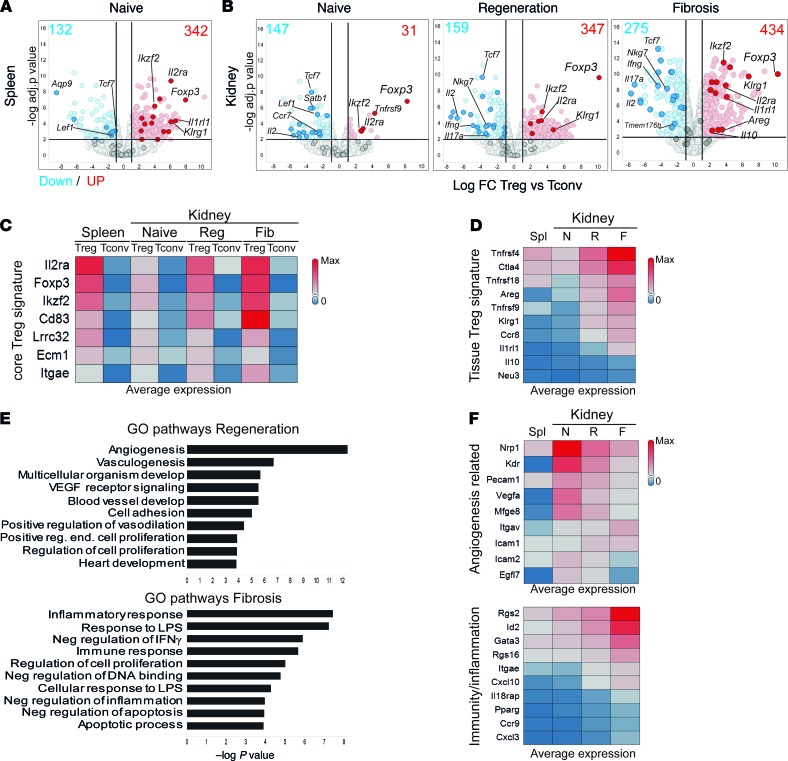
Figure 5. New markers of tissue-resident regulatory T cells during kidney injury and fibrosis.
Bulk RNA-Seq analysis showing detected transcriptional differences. (A and B) Volcano plots with the log fold change (FC) and P value for the comparison between Treg versus Tconv genes for the indicated conditions and tissues. Selected Tconv and core Treg genes are highlighted in blue and red, respectively. Numbers indicate the amount of upregulated (red, FC > 2) and downregulated (blue, FC < –2) genes. (C and D) Heatmap representations showing the average expression (FPKM, fragments per kilobase of exon model per million reads mapped) of core Treg signature genes (C) and tissue Treg genes (D) at the indicated conditions. (E) Gene Ontology (GO) pathway analysis showing the top 10 upregulated pathways in Tregs from regeneration (red, top) and fibrosis (blue, bottom), ranked by P value. (F) Heatmaps showing the expression of selected genes from the pathways in E. N, naive; R, regeneration; F, fibrosis; Spl, spleen.

