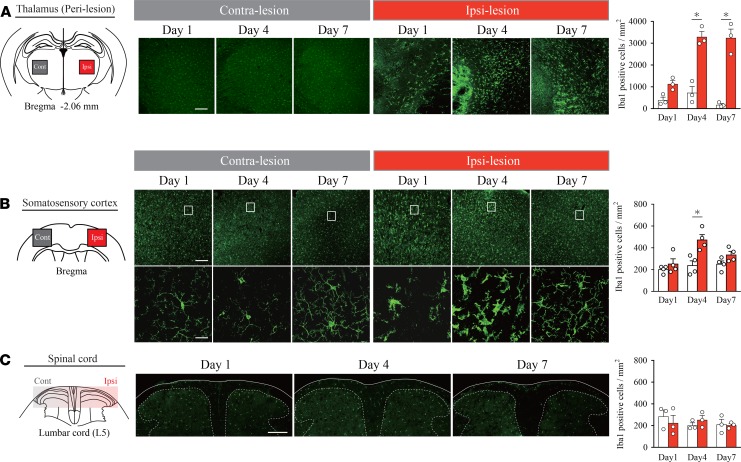
Figure 2. Microglia are activated in the perithalamic lesion sites and ipsilesional S1.
(A) Iba-1 immunostaining revealed microglial activation in the perilesional area on days 1, 4, and 7. Iba-1–positive cells in the perilesional area in the TH group were increased on days 4 and 7 compared with those in the Control (*P < 0.01, 2-way ANOVA followed by Sidak’s multiple comparisons test). Scale bar: 200 μm. (B) Morphological changes in microglia were also observed in the ipsilesional S1 on posthemorrhage days 1 and 4. Microglial activation was diminished on day 7 compared with that on day 4. Contralesional S1 showed no signs of microglial activation on posthemorrhage days 1, 4, and 7. Iba-1–positive cells in the ipsilesional S1 were increased on day 4 compared with those in the Control (*P < 0.01, 2-way ANOVA followed by Sidak’s multiple comparisons test). Scale bars: 200 μm (upper row) and 20 μm (lower row). (C) The morphology and distribution of microglia in the spinal cord did not change at any time point after hemorrhage (P > 0.05, group effect by 2-way ANOVA). Sections were taken from the level of lumbar 5.

