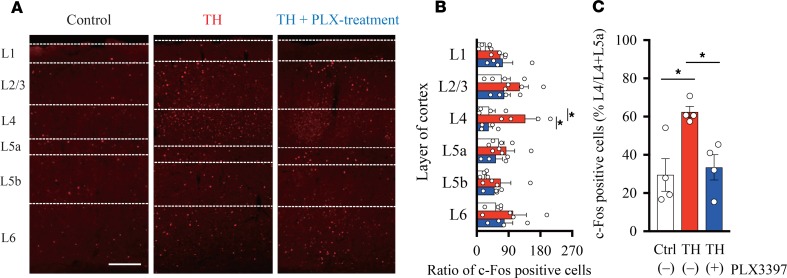
Figure 5. Microglial depletion prevents ectopic neuronal activity in the S1.
(A) Representative images of coronal brain slices of S1 stained for c-fos on day 7 after hemorrhage. Borders of the cortical layers were identified based on the distribution of DAPI- and Ctip2-positive cells. Scale bar: 200 μm. (B) The number of c-fos–positive cells was higher in layer 4 in the thalamic hemorrhage (TH) group compared with that in the Control (*P < 0.01, 2-way ANOVA followed by Tukey’s multiple comparisons test) and TH + PLX groups (*P < 0.01, 2-way ANOVA followed by Tukey’s multiple comparisons test). (C) The ratio of c-fos–positive cells distributed in L4 to all the neurons counted within L4 and L5a. The percentage of c-fos–positive cells was higher in the TH group than in the TH + PLX group (*P < 0.05, 1-way ANOVA followed by Tukey’s multiple comparisons test) and Control group (*P < 0.01, 1-way ANOVA followed by Tukey’s multiple comparisons test).

