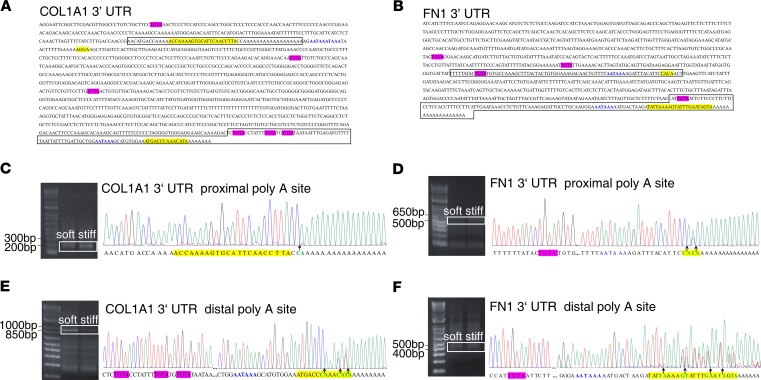
Figure 3. The 3′ UTRs of COL1A1 and FN1 harbor functional cis elements that mediate the cleavage and APA of COL1A1 and FN1 transcripts.
(A and B) Prediction analysis of the cleavage sites (yellow), UGUA-containing (or TGTA-containing) USEs (hot pink), and polyadenylation signals (blue) in the 3′ UTRs of COL1A1 and FN1 transcripts. (C–F) 3′ RACE products were separated on agarose gels, purified, and sequenced. Graphs show DNA sequences flanking the cleavage sites, as indicated by the boxed areas in A and B. Arrows indicate the cleavage sites.

