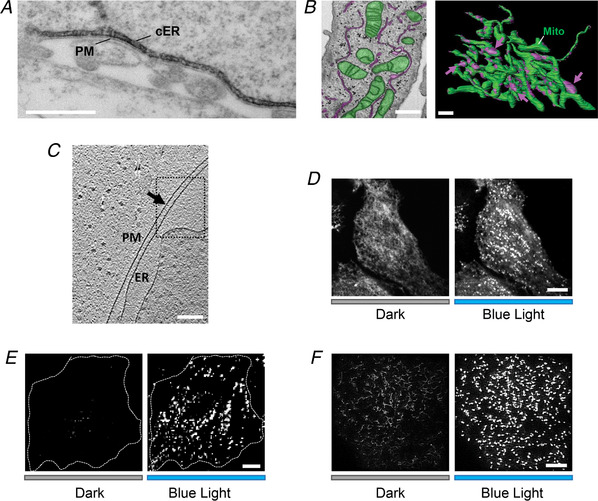
Figure 2. MCS visualization by electron microscopy and fluorescence microscopy.

A, a representative electron micrograph (EM) of HRP–STIM1 in HEK293 cells following Ca2+ store depletion. Scale bar, 500 nm. B, MCSs formed between ER (magenta) and mitochondria (green) in HeLa cells visualized by FIB‐SEM (left). The 3D model was built based on images acquired by reconstructing FIB‐SEM images (right). MCSs are indicated by magenta arrows. Scale bar, 1 µm. This image from Hirabayashi et al. (2017) is republished with permission from the American Association for the Advancement of Science. C, a representative Cryo‐ET image of ER–PM contact sites in COS‐7 cell. Scale bars, 200 nm. This image from Collado & Fernandez‐Busnadiego (2017) is republished with permission from Elsevier Science and Technology Journals. D–F, light‐induced alterations in the distribution of mRuby2‐OptoPBer at the footprint of HeLa cells imaged by confocal microscopy (D), TIRFM (E) and SIM (F), respectively. Transfected cells were either shielded (black bar) or exposed to blue light illumination for 60 s (blue bar). Scale bar, 10 µm.
