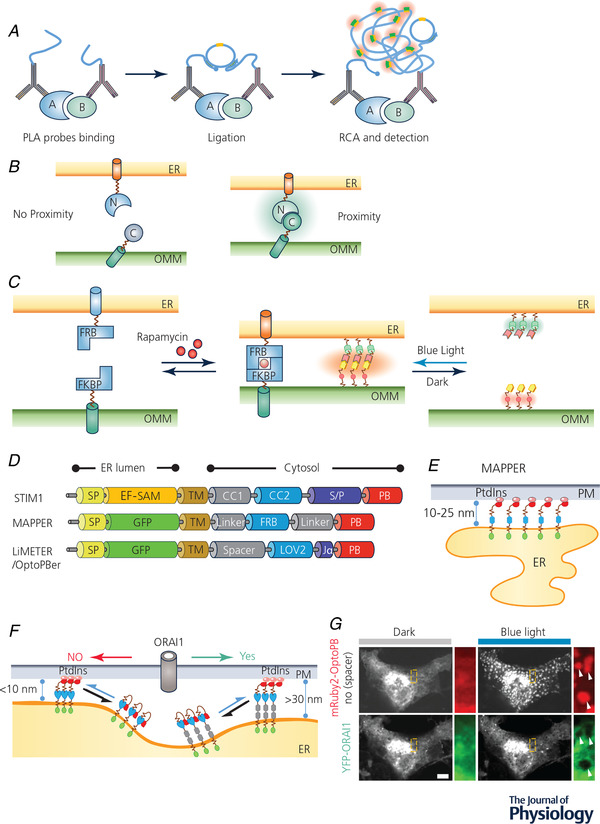
Figure 3. MCS visualization and manipulation with chemogenetic or optogenetic tools.

A, cartoon illustration of the proximity ligation assay (PLA). RCA, rolling circle amplification. B, detection of MCS‐resident proteins by bimolecular fluorescence complementation (BiFc). Two non‐fluorescent fragments of a fluorescent protein (FP) were individually anchored to the opposing membranes of different organelles. When the two organellar membranes are positioned in close proximity, an intact FP will be reassembled to emit fluorescence. C, inducible intermembrane tethering between ER and mitochondria. The tethering can be achieved by either using a rapamycin/FRB/FKBP‐based chemical dimerization module (left) or an iLID‐based optical dimerizer (right). ER, endoplasmic reticulum; FKBP, FK506 binding protein; FRB domain, FKBP12‐rapamycin binding domain; OMM, outer mitochondrial membrane. D, scheme illustrating the domain architecture of MAPPER, LiMETER and OptoPBer, which can be used to visualize or inducibly control MCS formation at ER–PM junctions. CC, coiled coild region; EF‐SAM: EF‐hand and sterile alpha domain; FRB, FKBP‐rapamycin binding domain; LOV2, light‐oxygen‐voltage domain 2; PB, polybasic domain; SP, ER‐targeting signal peptide; S/P, serine/proline‐rich region; TM, transmembrane domain. E, schematic illustration of MAPPER at ER–PM junctions. F, cartoon illustrating light‐inducible assembly of ER–PM MCS mediated by LiMETER or OptoPBer. By tuning the spacer within these optogenetic constructs, the ER–PM gap distance can be tuned to manipulate the diffusion of PM‐resident proteins (e.g. ORAI1) into ER–PM contact sites. G, a confocal image showing the exclusion of ORAI1–YFP (green) from ER–PM contact sites marked by mRuby2–OptoPBer (red) when the gap distance was shortened to less than 10 nm in response to blue light stimulation. White arrows indicate ORAI1 exclusion from ER–PM MCSs. Scale bar, 5 µm.
