Figure 2:
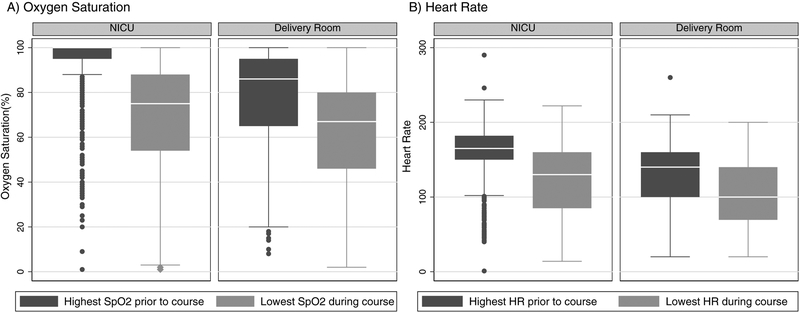
Box plot (median, IQR, and range) A) demonstrating highest percent oxygen saturation (SpO2) prior to course and lowest documented level during course* B) demonstrating highest heart rate (HR) prior to course and lowest HR during intubation course**
* Reported only for patients with SpO2 data available: NICU: n=2197, DR: n=645
** Reported only for patients with HR data available: NICU: n=2177, DR: n=680
***Median difference in highest pre-intubation SpO2 and lowest SpO2 was larger in the NICU than the DR (20%, IQR 8%−40% versus 12%, IQR 5%−23%, P<0.001). Median difference in highest pre-intubation HR and lowest HR was larger in the NICU than the DR (26 bpm, IQR 10–70 versus 20 bpm, IQR 5–40, P<0.001).

