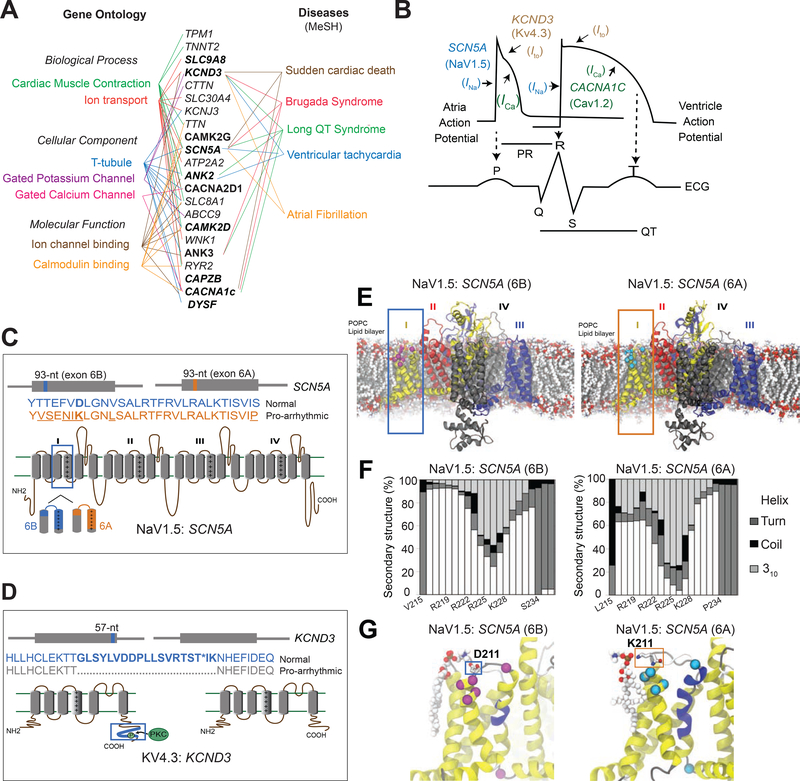
Figure 6. Structure-function analysis of normal and DM1-related splice isoforms of voltage-gated sodium, calcium, and potassium channels.
(A) The subset of cardiac arrhythmia-associated genes misspliced following RBFOX240 overexpression in cardiomyocytes with their respective Gene Ontology terms (Left) and MeSH disease headings (Right). Genes misspliced similarly in the hearts of DM1 patients are highlighted in bold letters. (B) Schematic representation of action potentials from atria and ventricles, and their correlation with the surface electrocardiogram (ECG). The sodium channel SCN5A (NaV1.5) mediated Ina current, calcium channel CACNA1C (CaV1.2) mediated Ica current, and potassium channel KCND3 (KV4.3) mediated Ito current with their respective functions in propagation and duration of a typical action potential are depicted. Cartoons representing topology, relative locations and amino acid sequences for the two alternatively spliced exons in (C) SCN5A, and (D) KCND3 proteins. (E) Molecular dynamics (MD) simulation showing modelled structure of NaV1.5:SCN5A (6B) and (6A) exon containing isoforms embedded in a 1-palmitoyl-2-oleoyl-sn-glycero-3-phosphocholine (POPC) lipid bilayer. Domains I-IV of the channel are represented by yellow, red, black and blue colors respectively. Differences in protein sequence are highlighted on the structure by magenta/cyan spheres and sticks. (F) Secondary structure content of domain I segment S3-S4 observed in MD simulations for the two isoforms. (G) Representative snapshots of MD simulations highlighting differential interactions of D211 in 6B (Left) and K211 in 6A (Right) with the lipid head group. The non-conserved residues between the two isoforms are shown in Van der Waals (VdW) representation. The protein is colored based on the secondary structure, yellow: α-helix, blue: 310-helix, gray: turn, white: coil.

