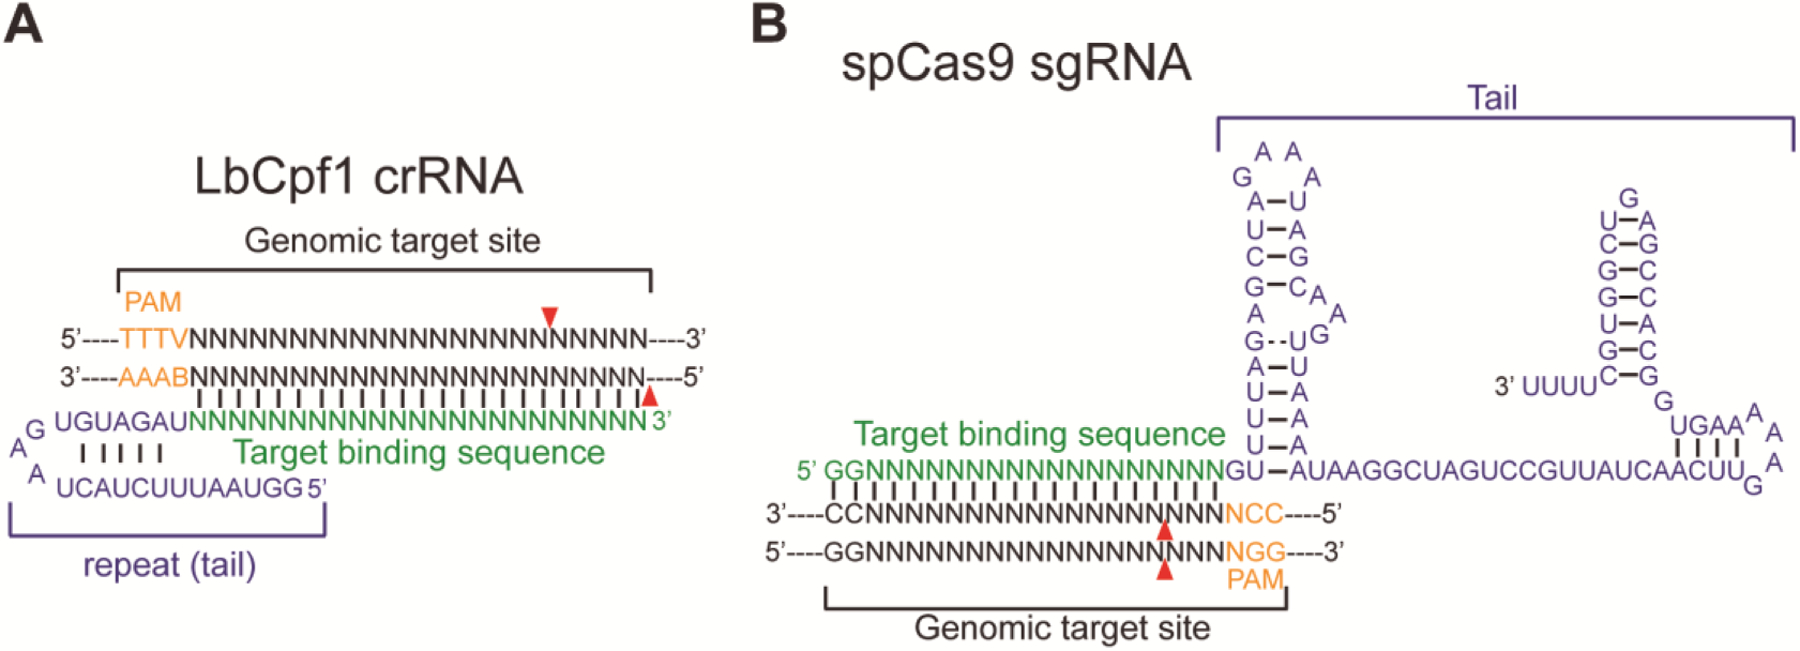
Fig. 1. CRISPR-LbCpf1 compared to CRISPR-SpCas9.

A. Schematic illustrating a LbCpf1 crRNA (binding sequence in green, repeat in blue) binding to the genomic target site (black) and the PAM sequence 5’-TTTV (orange). Red triangles indicate predicted cleavage sites.
B. Schematic showing a sgRNA (binding sequence in green, tail in blue) binding to the genomic target site (black) and the PAM sequence 5’-NGG (orange). Red triangles indicate predicted cleavage sites. Adapted from [8].
