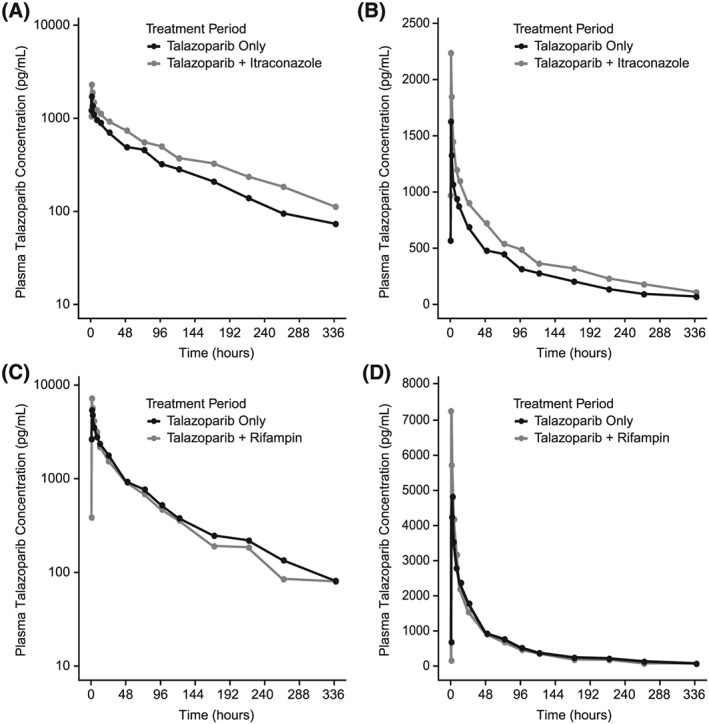
Figure 2.

Median plasma talazoparib concentration–time profile following a single dose of talazoparib alone and with multiple doses of itraconazole (semilogarithmic, A; linear, B) or following a single dose of talazoparib with multiple doses of rifampicin (semilogarithmic, C; linear, D). Concentration values below the lower limit of quantification were set to zero. Only pharmacokinetic samples collected within the 10% of the scheduled time point are included
