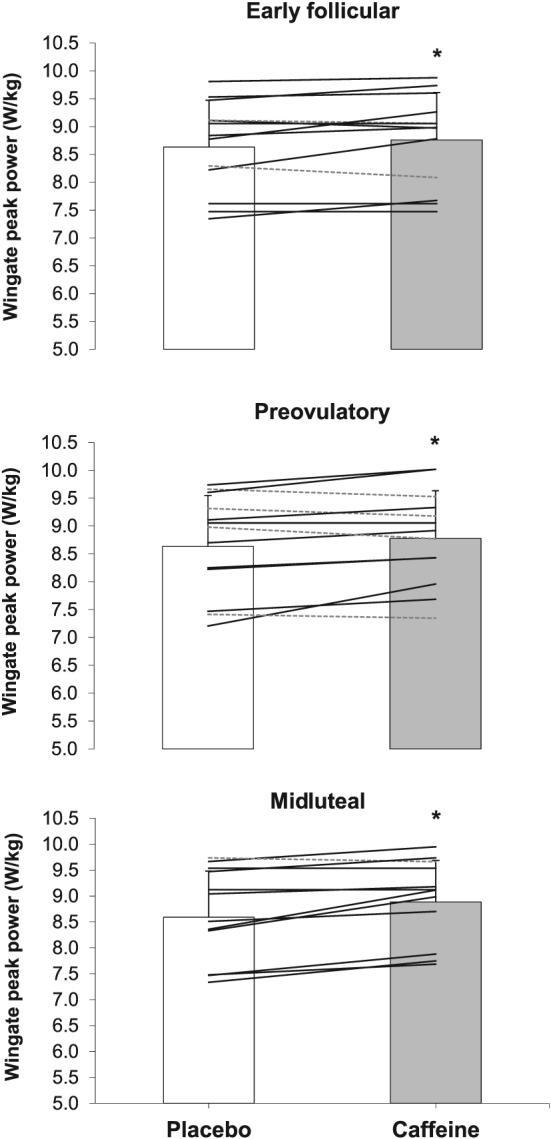
Figure 1.

Peak cycling power (W/kg) during a 15‐s Wingate test with the administration of 3 mg kg−1 of caffeine or a placebo in the early follicular, preovulatory, and midluteal phases of the menstrual cycle.The columns represent the group's average and the whiskers represent 1 standard deviation. The solid lines represent individual responses for participants with increased Wingate peak power in the caffeine vs placebo comparison. The dotted lines represent individual responses in subjects that decreased Wmax as a result of caffeine ingestion. (*) Caffeine different from placebo within the same menstrual cycle phase at P < .05
