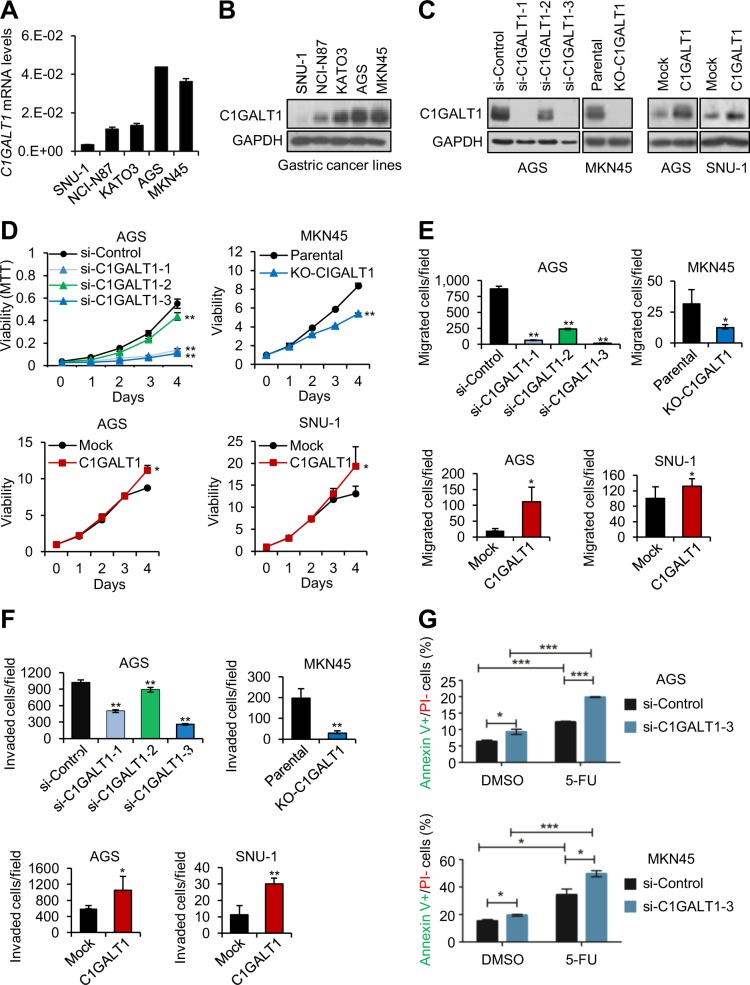
Fig. 2. C1GALT1 promotes malignant behaviors of gastric cancer cells.
a C1GALT1 expression in gastric cancer cells analyzed by Q-RT-PCR. b C1GALT1 expression in gastric cancer cells analyzed by western blot analysis. c Western blots showing C1GALT1 knockdown (left panel) or overexpression (right panel) in gastric cancer cells. For knockdown, AGS cells were transfected with nontargeting siRNA (si-Control) or three independent siRNAs against C1GALT1 (si-C1GALT1-1, si-C1GALT1-2, and si-C1GALT1-3). For C1GALT1 knockout in MKN45 cells, CRISPR/Cas9 system was used. For overexpression, AGS and SNU-1 cells were transfected with empty pcDNA3.1 (Mock) or C1GALT1-pcDNA3.1 (C1GALT1) plasmid. d Cell viability was analyzed using MTT assays. C1GALT1 knockdown or knockout decreased cell viability in AGS and MKN45 cells, respectively (upper panel). C1GALT1 overexpression enhanced cell viability in AGS and SNU-1 cells (lower panel). Data are presented as mean (n = 3) ± SD. e Cell migration was analyzed using transwell migration assays. C1GALT1 knockdown or knockout decreased cell migration in AGS and MKN45 cells, respectively (upper panel). C1GALT1 overexpression enhanced cell migration in AGS and SNU-1 cells (lower panel). Data are presented as mean (n = 3) ± SD. f Cell invasion was analyzed using Matrigel invasion assays. C1GALT1 knockdown or knockout decreased cell invasion in AGS and MKN45 cells, respectively (upper panel). C1GALT1 overexpression enhanced cell invasion in AGS and SNU-1 cells (lower panel). Data are presented as mean (n = 3) ± SD. g C1GALT1 knockdown enhanced 5-FU-induced apoptosis in AGS and MKN45 cells. C1GALT1 was knocked known with si-C1GALT1-3 and then treated with solvent DMSO or 5 µg/ml of 5-FU. Apoptosis was analyzed using flow cytometry with FITC-annexin V and PI. Cells were cultured or stimulated with 10% FBS as a chemoattractant. Representative results are shown from at least three independent experiments. Statistical data were analyzed and obtained through Student’s t test and graphed as mean ± SD. *p < 0.05; **p < 0.01; ***p < 0.001.

