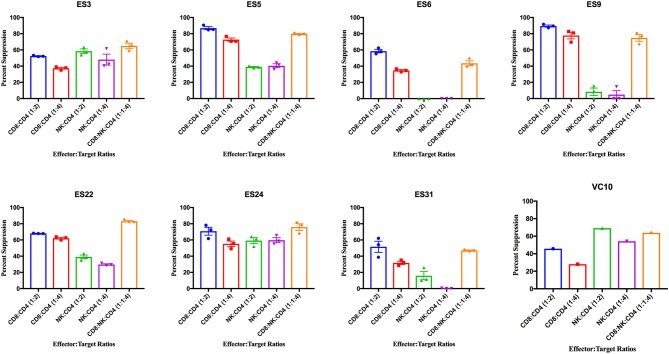
Figure 3.
Viral suppression induced by CD8+ T cells, NK cells, and a combination of the two effector cells at the indicated effector to target ratios for each individual. The bar is set to the mean value from 3 replicates per subject with the exception of VC10 where a single replicate was run due to limited numbers of cells. Error bars are the standard error of the mean.

