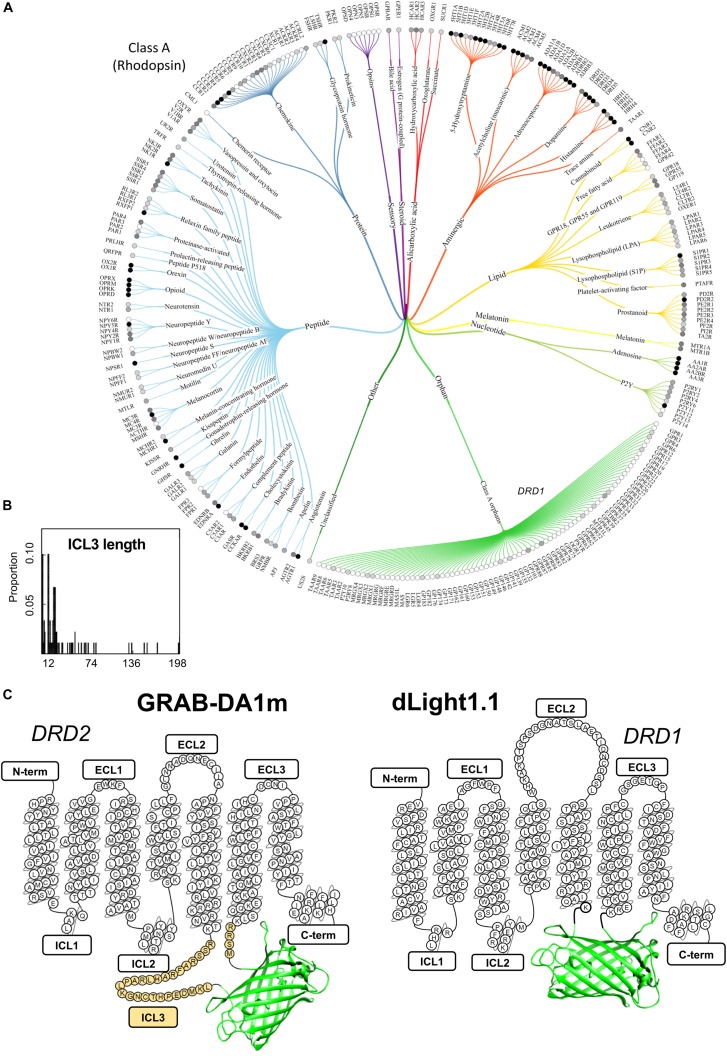
FIGURE 1.
A snapshot of the current GPCR sensor engineering landscape. (A) Class-A GPCR family tree. Receptors are grouped and branches are color-coded based on ligand type. Gray-scale circles in front of the receptor name represent the number of currently available ligands (white: 0, light gray: >100, gray: >500 and black: >1000). Reproduced from Pándy-Szekeres et al. (2018). (B) Length distribution of ICL3 (region where cpGFP is inserted during the sensor engineering process) for several class-A GPCRs highlights the high degree of variability in this region among different receptors. The number of ICL3 aminoacid residues is shown on the x axis, while the relative probability of each length from a total of 89 analyzed GPCRs is shown on the y axis. Reproduced with permission from Otaki and Firestein (2001). (C) Schematic depiction of representative members of the two classes of genetically encoded dopamine sensor classes developed to date: dLight1.1 and GRAB-DA1m. Aminoacid residues of sensor sequence belonging to the original dopamine receptors (DRD1 and DRD2) are shown in the snake-plot. The insertion position of circularly permuted green fluorescent protein (cpGFP) is indicated for both sensor types. N-term, N-terminus; ICL, intracellular loop; ECL, extracellular loop; C-term, C-terminus. Third intracellular loop, ICL3, is highlighted in yellow.

