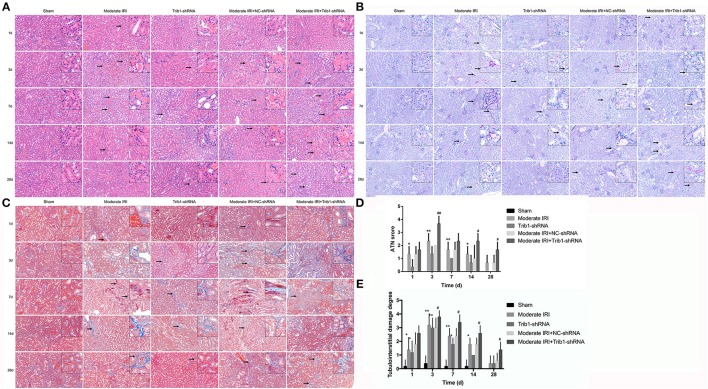
Figure 3.
Histopathological detection in mice. (A) HE staining of different groups of mice (sham, Trib1 shRNA, moderate IRI, moderate IRI+Trib1 NC shRNA and moderate IRI+Trib1 shRNA groups) at different time points. The arrows indicate the areas of inflammation. (B) PAS staining of the five groups of mice. The arrows indicate pathological changes in the renal tissue. (C) Masson's trichrome staining of the five groups of mice. The arrows indicate fibrotic areas. (D) Acute tubular necrosis (ATN) score in the renal tissue of the above five groups. (E) Tubulointerstitial damage degree of the above five groups. Scale bar: 50 μm. * indicated the group of moderate IRI VS the group of Sham. # indicated moderate IRI+Trib1 NC shRNA VS. moderate IRI+Trib1 shRNA. *,#p < 0.05; **,##p < 0.01.

