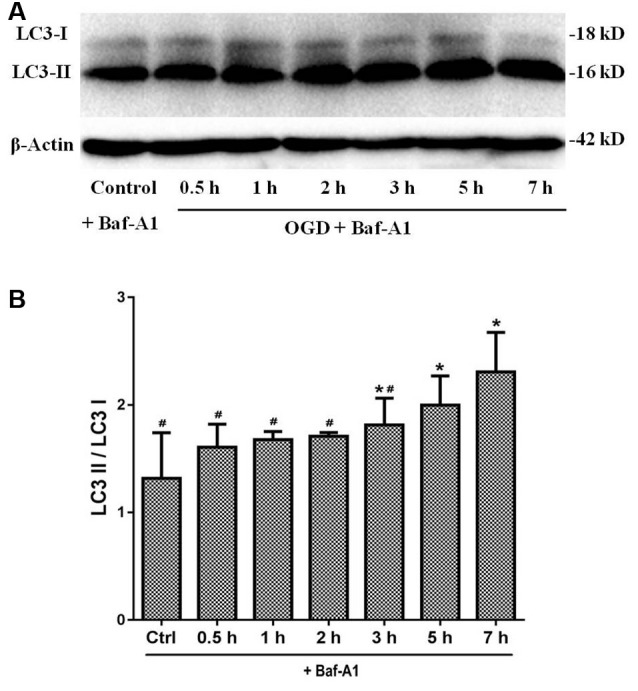
Figure 7.

LC3 expression under OGD with Baf-A1 to observe the real state of autophagic flux. (A) The expression of LC3 I and LC3 II were detected by Western blot. In the presence of Baf-A1, LC3 II dramatically increased and accumulated. (B) The quantitative results are shown in the bar chart. Data were presented as mean ± SD (n = 3 independent experiments). Statistical comparisons were carried out with one-way ANOVA. *p < 0.05 compared with the control group. #p < 0.05 compared with the 7-h group.
