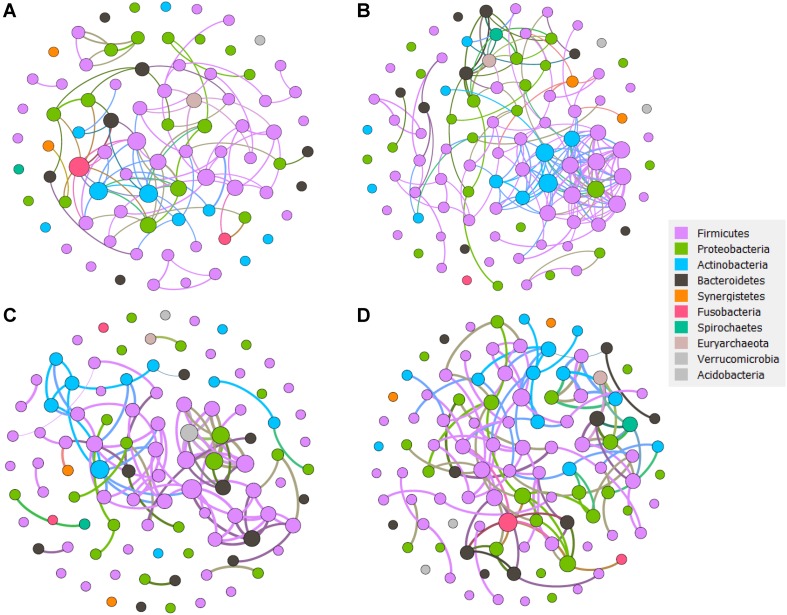
FIGURE 6.
The network analysis revealing the co-occurrence patterns between bacterial taxa for each sample group. (A) Healthy group network. (B) HBVI group network. (C) CHB group network. (D) LC group network. The nodes were colored according to the phyla assigned by the taxa. A connection represents a strong (Spearman’s correlation coefficient R2 > 0.6) and significant (p < 0.05) correlation. Edges weighted according to the correlation coefficient and node size weighted according to the relative abundance of microbial taxa.

