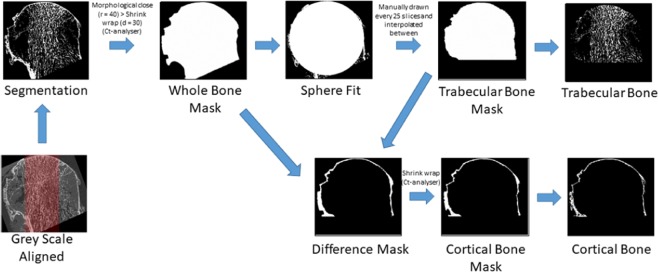
Figure 1.
Flow diagram illustrating the methods to extract the trabecular bone cortical bone volumes for morphometric analysis. The mean trabecular direction (MTD) (highlighted in red) was aligned with the supero-inferior (SI) axis in the coronal and sagittal views. 16-bit grey scale images were binarised by implementing a global threshold based on the image stack histogram. A mask of the whole bone was used to determine the radius and centre of a best fit sphere within the femoral head. The centroid was used as the lower slice for the region over with the analysis was performed.

