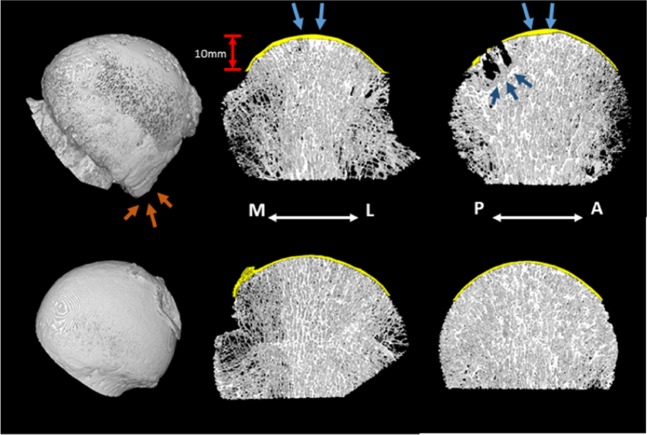
Figure 3.
3D renderings of one of the OA (top) and HC (bottom) specimens. 2 mm slices in the coronal plane (centre) and sagittal plane (right) illustrate the presence of cysts and sclerotic bone (dark blue arrows) in the OA specimens. The SBP is shown in yellow and a thickening of the plate directly above the MTD (blue arrows) is evident in the OA specimens. A rendering of the entire femoral head (left) illustrates the significant osteophytosis in the OA specimens (orange arrows).

