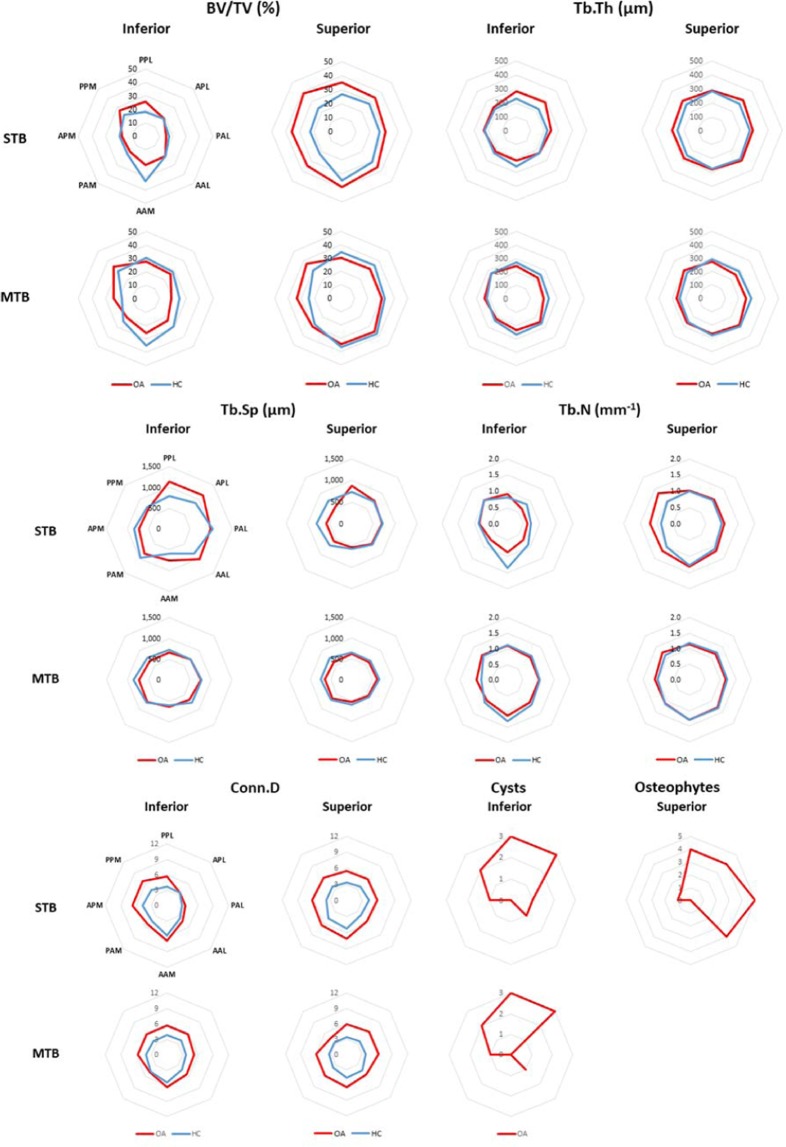
Figure 6.
Regional distribution of the median value for the morphometric parameters evaluated within the trabecular bone for OA (red) and HC (blue) specimens. For each parameter, the measurements in the STB hemisphere are shown at the top, and the measurements in the MTB hemisphere are shown on the bottom; the inferior regions are shown in the left column, and the superior regions in the right column. The same regional classification was used for each graph but was reported only on the top left graph (PPL = posterior poster-lateral; APL = anterior postero-lateral; PAL = posterior antero-lateral, AAL = anterior antero-lateral; AAM = anterior antero-medial; PAM = posterior antero-medial; APM = anterior postero-medial; PPM = posterior postero-medial).

