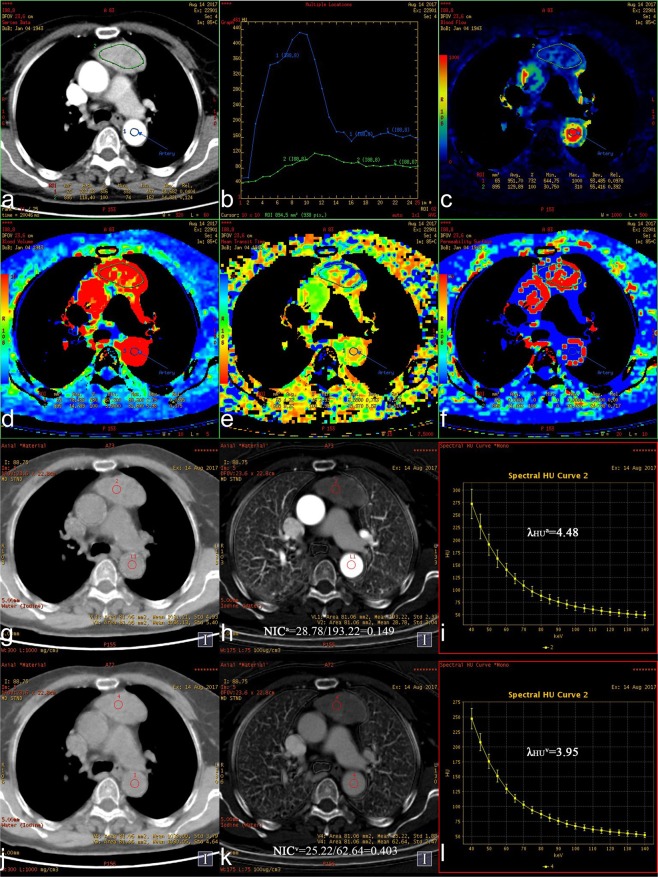
Figure 3.
(a–l) Axial images showing a thymic carcinoma (75 y, M). (a) Original image (mixed energy) of the chest showing a left anterior mediastinal mass. ROI 1 was selected from the aorta to calculate the TDC curve automatically. ROI 2 was selected from the tumor to calculate perfusion parameters automatically. (b) The optimal arterial phase (tenth) and venous phase (twenty-first) were obtained in the TDC curve. (c,d,e,f) BF, BV, MTT, and PS value were 61.71 ml/min/100 g, 7.03 ml/100 g, 9.47 s and 41.33 ml/min/100 g respectively, in pseudo-color maps. (g,h, i) WCa, ICa, NICa and λHUa values of the tumor were 1038.60 mg/cm3, 11.83 × 10² μg/cm3, 0.087, and 1.90 in the Water (Iodine), Iodine (Water) and spectral curve maps respectively, in the optimal arterial phase. (j,k,l) WCv, ICv, NICv and λHUv values of the tumor were 1040.87 mg/cm3, 14.18 × 10² μg/cm3, 0.357, and 2.28 in the Water (Iodine), Iodine (Water) and spectral curve maps respectively, in the optimal venous phase.

