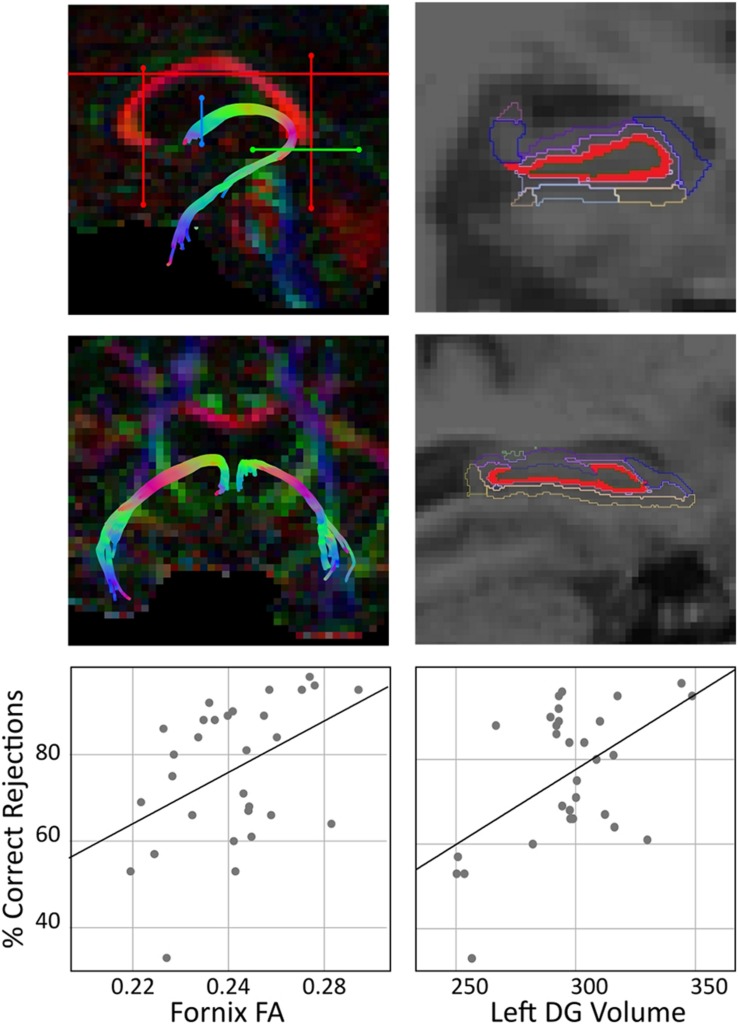
FIGURE 1.
Tractography analysis, hippocampal subfields representation, and their correlation with memory performance. The left panel shows a sagittal and a coronal section of the fornix, and the tactography using ROI waypoints (Leemans et al., 2009) (“SEED” ROI is shown in blue, “AND” ROI is shown in green, and “NOT” ROIs are shown in red) for the fornix in the native space of one participant. The scatter plot shows a positive correlation of fornix FA and percentage of correct rejections, corrected for age (partial r = 0.403, p = 0.030). The right panel shows hippocampal subfields segmentation performed using FreeSurfer v6.0 algorithm. This segmentation resulted in 12 subfields; DG is shown in red and all remaining subfields are shown in colored outline. The scatter plot shows a positive correlation of left DG volume (in mm3) and% correct rejections, adjusted for age (partial r = 0.501, p = 0.006). Note that for both correlations, sensitivity analysis without the low performing participant was conducted and results showed similar partial correlation coefficients (correlation of fornix FA and% correct rejections: r = 0.416, p = 0.028; correlation of left DG volume and % correct rejections: r = 0.449, p = 0.017).

