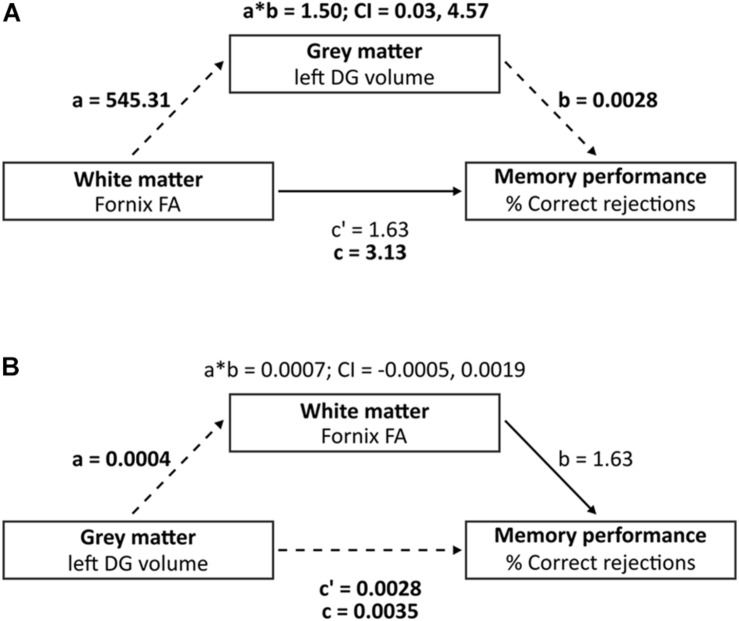
FIGURE 2.
Mediation analysis investigating the three-way association between left DG volume, Fornix FA and percentage of correct rejections. (A) Mediation analysis (model A) where “a” indicates the effect of fornix FA on left DG volume, “b” indicates the effect of left DG volume on % correct rejections, adjusted for fornix FA, i.e., direct effect of left DG volume on % correct rejections, “c” indicates the direct effect of fornix FA on % correct rejections, and “c” indicates the total effect (direct and indirect) of fornix FA on % correct rejections. (B) Reverse mediation analysis (model B) where “a” indicates the effect of left DG volume on fornix FA, “b” indicates the effect of fornix FA on % correct rejections, adjusted for left DG volume, i.e., direct effect of fornix FA on % correct rejections, “c” indicates the direct effect of left DG volume on % correct rejections, and “c” indicates the total effect (direct and indirect) of left DG volume on % correct rejections. Dashed lines indicate significant paths and bold font indicates significant terms. Bias-corrected 95% CI is displayed for the indirect effects (a∗b).

