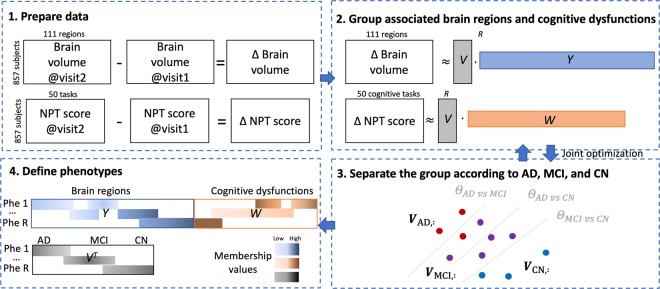
Figure 1.
Workflow from Data Preprocessing to Interpretation of Phenotypes. NPT = Neuropsychological tests. R = the number of phenotypes. (1) Prepare data: We analyzed the longitudinal changes between two visits in the brain volume of each brain region and the NPT scores. Brain volume changes were M: = Δ Brain volume = Brain volume at visit 2 – Brain volume at visit 1. NPT score changes were X: = Δ NPT score = NPT score at visit 2 – NPT score at visit 1. (2) Group using matrix factorization: We derived phenotypes as a set of associated brain regions and cognitive dysfunction. Brain volume changes M is decomposed into V (subject’s membership) and Y (brain region’s membership). NPT score changes X is decomposed into V (subject’s membership) and W (cognitive task’s membership). We used coupled nonnegative matrix factorization to harmonize the two information. (3) Sep arate the groups by multi-label support vector machines: We encouraged the V (subject’s membership), Y, and W to reflect subject’s disease stages (AD, MCI, and CN). The matrix factorization and the support vector machines are jointly optimized. (4) Define phenotypes: We analyzed clinical relevance of the cognitive dysfunction and related brain volume loss.

