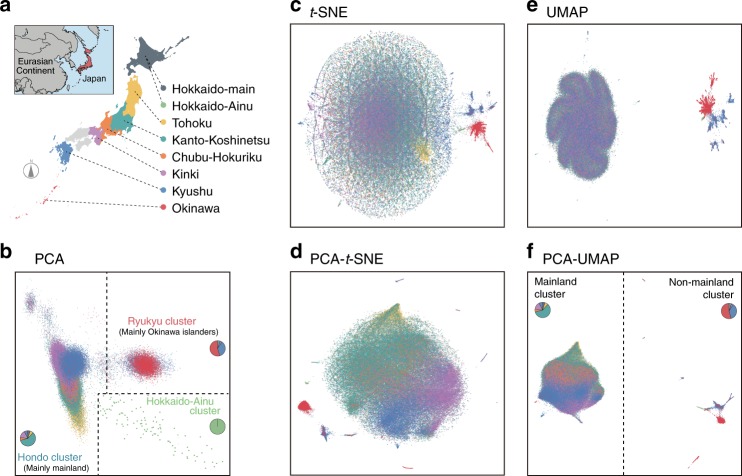
Fig. 2. Dimensionality reduction of biobank-scale genotype data from the Japanese population.
Two-dimensional illustrations of biobank-scale genotype data from the Japanese population by the five dimensionality reduction methods. The color of individual points indicates the region where a given study individual was recruited. a Geographic description of the Japanese islands and the definitions of the regions and colors. b The first two principal components from PCA. Individuals in Hondo (mainly in the mainland), in Ryukyu (mainly in Okinawa and surrounding islands), and in Hokkaido-Ainu (indigenous population in Hokkaido) were defined as described previously. c–e Two-dimensional illustrations by c t-SNE, d PCA-t-SNE, e UMAP, and f PCA–UMAP. Individuals in the mainland and non-mainland clusters were defined based on the PCA–UMAP results. The pie charts depicted in b, f represent the constitutions of individuals, who were marked according to the recruitment regions in corresponding colors.

