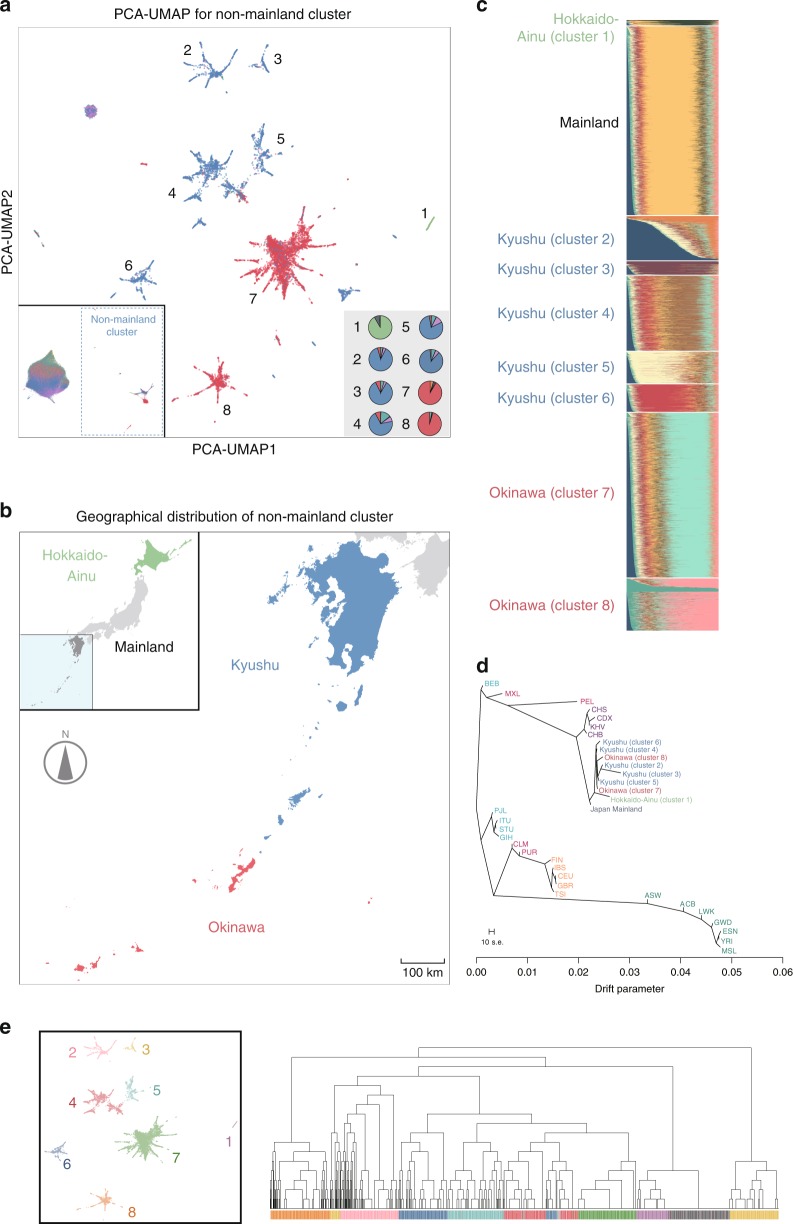
Fig. 3. Fine-scale population structure disentangled by PCA–UMAP, and its validation using population genetics methods.
a Secondary PCA–UMAP to individuals within the non-mainland cluster. The color of individual points indicates the region from which a given study individual was recruited, as shown in Fig. 2. The numbers (1–8) in the main figure represent the subcluster definition, which is described in detail in Supplementary Fig. 4. The bottom-left inset shows the results of PCA–UMAP to all the individuals in the cohort, and the pie charts in the bottom-right inset represent the constitutions of the subcluster individuals annotated according to the recruitment regions in corresponding colors. b Geographic and color descriptions of the regions shown in a. The inset describes the Japanese islands, and the main panel describes the expanded view of the southwest islands of the Ryukyu region of Japan (regions colored in blue in the inset). c ADMIXTURE analysis using the unsupervised maximum-likelihood method under a model with 11 ancestral components (k = 11). d Maximum-likelihood phylogenetic tree of the Japanese subpopulations defined in Fig. 3a and of the worldwide populations from the 1KGP. The scale bar shows the average standard error of the entries in the covariance matrix. e Correspondence between the secondary PCA–UMAP to the non-mainland cluster and the hierarchical clustering performed by using fineSTRUCTURE. The right panel shows the clustering results of fineSTRUCTURE, in which individuals are annotated and colored according to the subclusters defined by PCA–UMAP (left panel).

