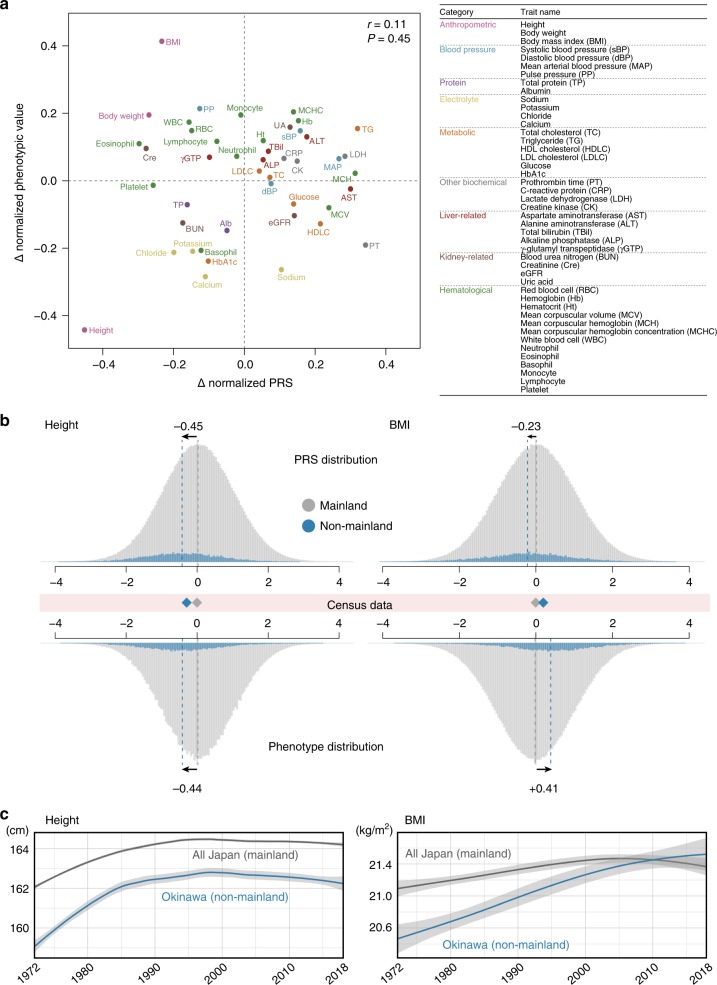
Fig. 5. Polygenic risk score differentiations between mainland and non-mainland Japanese individuals.
a Co-plot of the Δ normalized PRS and Δ normalized phenotypic value of 45 quantitative traits. The Δ normalized PRS (=normalized PRS in non-mainland−normalized PRS in mainland) is shown on the x-axis, and the Δ normalized phenotypic value (=normalized phenotypic value in non-mainland−normalized phenotypic value in mainland) is shown on the y-axis. Pearson’s correlation r and P value between the Δ normalized PRS and the Δ normalized phenotypic value are also described. The color of the dots represents the category of each trait. The right table shows the trait categories in color and the abbreviations of the traits. b Histograms of the PRS (top) and observed phenotypic value (bottom) for height (left) and BMI (right). In each panel, the distribution in the mainland is colored in gray, and that in non-mainland is colored in blue. The mean values of height and BMI retrieved from census data are shown in the middle, between the PRS and phenotypic histograms. The blue diamonds are the per-SD differences of height and BMI in non-mainland individuals. c Longitudinal census data of height (left) and BMI (right) in Japan. In each plot, the mean trait value of the general Japanese as a proxy of mainland (gray) and that of residents in Okinawa prefecture as a proxy of non-mainland (blue) are illustrated. The gray shadow indicates the 95% confidence interval.

