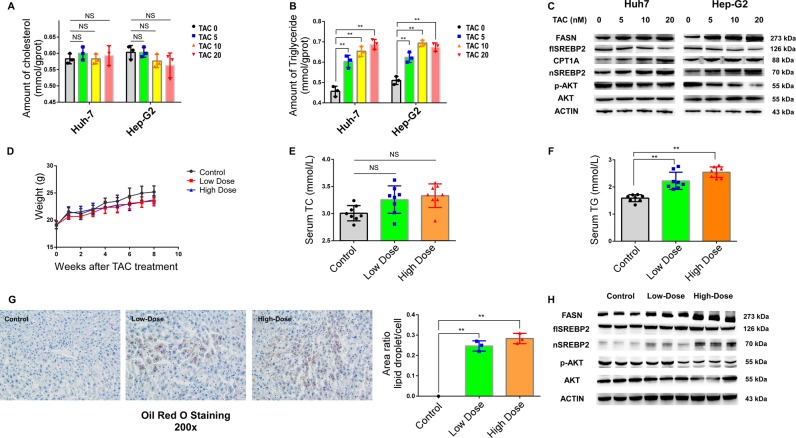
Fig. 1. Tacrolimus (TAC) treatment increased the amount of triglycerides in vivo and in vitro.
a, b Triglyceride and cholesterol levels measured by the glycerol lipase oxidase (GPO-PAP) method in Huh7 and Hep-G2 cells treated with different concentrations of TAC. c FASN, SREBP2, and AKT protein expression in Huh7 and Hep-G2 cells analyzed by western blotting. d Body weight of mice assessed every week in the control (black), low-dose TAC (red), and high-dose TAC (blue) mouse groups (n = 8 per group). e, f Serum total cholesterol (TC) and triglycerides (TG) assessed 8 weeks after the initial TAC injection. g Hepatic triglyceride levels were measured by Oil red O staining. h FASN, SREBP2, and AKT protein expression in mouse liver was analyzed by western blotting. Data represent the mean ± SD. *P < 0.05, **P < 0.01, NS, not significant, TAC groups vs. control. The experiments were independently repeated at least three times.

