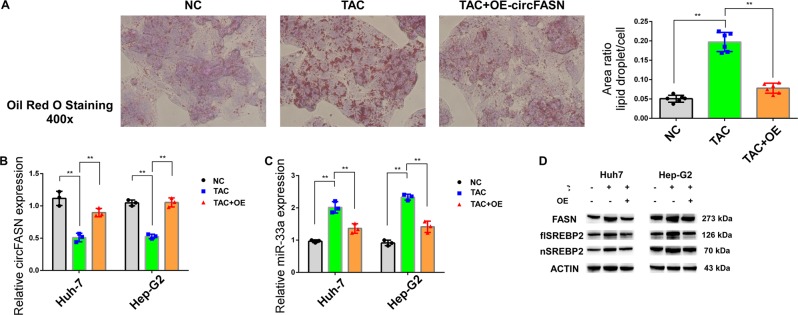
Fig. 6. circFASN overexpression blocked TAC-induced triglyceride accumulation.
a Triglyceride levels in Hep-G2 cells measured by Oil red O staining in the negative control (NC), TAC only -treated, and TAC and circFASN OE plasmid-treated groups. The ratio of the area of lipid droplets to that of a single cell was used to evaluate lipid content in cells. b, c Relative expression of circFASN and miR-33a in the NC, TAC, and TAC+OE groups detected by qPCR. d Protein expression of FASN and SREBP2 in Huh7 and Hep-G2 cells analyzed by western blotting. Data represent the mean ± SD. *P < 0.05, **P < 0.01, NS, not significant, TAC groups vs. the control or OE group. The experiments were independently repeated at least three times.

