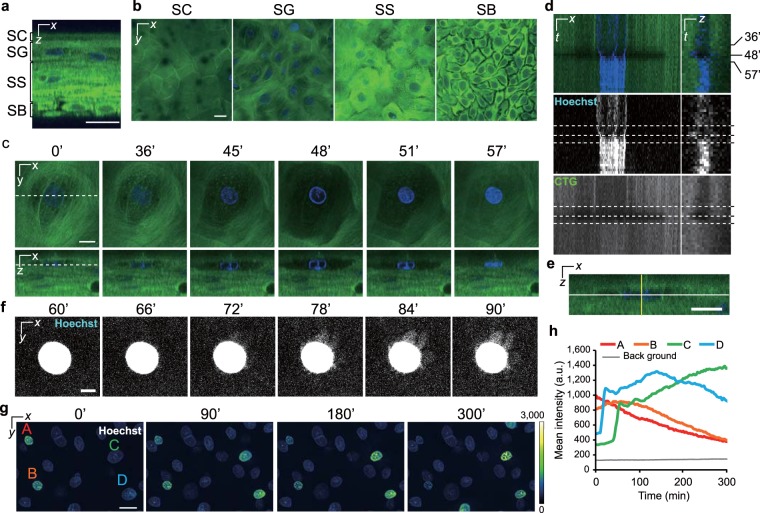
Figure 1.
Alterations in the cellular and nuclear morphology during cornification. (a) A representative orthogonal image of an epidermal model labelled with Hoechst 33258 (blue) and CTG (green). (b) A series of optical sectioned images of the SC, SG, SS, and SB. (c) Time-lapse images collected with a 3-min interval. Dashed lines indicate the sectional planes. The granular cell shape began to change at 36 min, following which the cell expanded until 48 min and became flattened at 57 min. (d) Kymographs of the nucleus and cell shape taken from time-lapse images in c. Kymographs on the left and right were generated from the white and yellow lines in e, respectively. The upper, middle, and lower panels show the merged images, nuclear signals, and CTG signals, respectively. Dashed lines show the time at 36, 48, and 57 min. (e) A cropped orthogonal image at 0 min in c. (f) Maximum intensity projections of a nucleus after flattening. These images consist of 10 images in the z-direction (6 μm). Note that the brightness was adjusted to visualize low signals. (g) Pseudocoloured maximum intensity projections of nuclei before and after flattening. These images consist of 20 images in the z-direction (12 μm). The A and B cells were already flattened before observation. The C and D cells became flattened during observation. (h) A graph of the nuclear mean intensities of the marked cells (A–D) in g. Scale bars, 20 μm (a,b,g), 10 μm (c,e), or 5 μm (f).

