Figure 2.
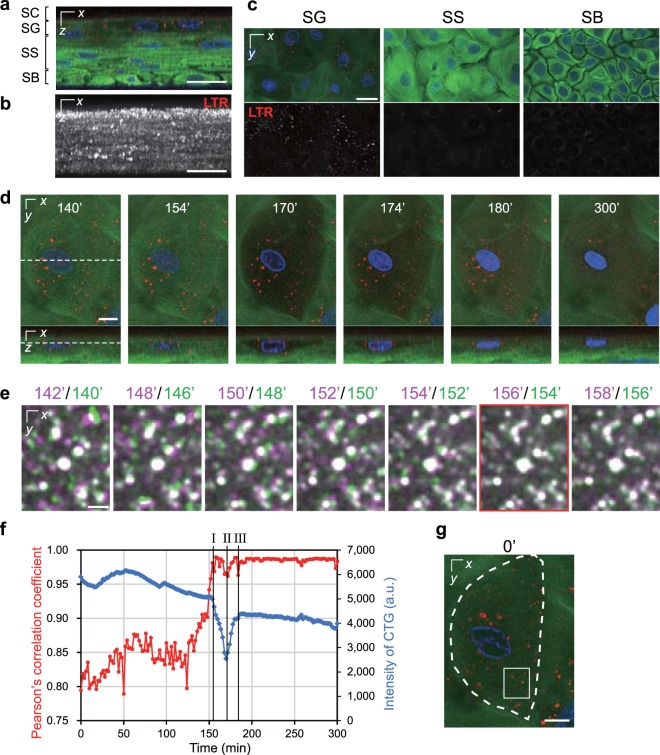
The temporal relationship between the stoppage of acidic vesicles and morphological change. (a) A representative orthogonal image of the epidermal model labelled with Hoechst 33258 (blue), CTG (green), and LTR (red). (b) A maximum intensity projection of only LTR signals in a. (c) A series of optical sectioned images of the SG, SS, and SB. The upper and lower panels show the merged images and LTR signals, respectively. (d) Time-lapse images collected with a 2-min interval. Dashed lines indicate the sectional planes. The granular cell shape began to change at 154 min, following which the cell expanded until 170 min and became flattened at 180 min. (e) Enlarged merged images of LTR signals from the neighbouring timeframe taken from time-lapse images. Magenta indicates 2 min after the signals in green. (f) A graph of Pearson’s correlation coefficient for the colocalization of two LTR signals versus time (red line) and intensity of CTG (blue line) that were obtained from the time-lapse images. The vertical lines I, II, and III indicate the beginning of the morphological change, cellular expansion, and complete flattening, respectively. (g) The regions for analysis in e (the white rectangle) and f (indicated by a dashed line). The data in e–g based on the time-lapse images in d. The data are representative of 22 cells (4 independent experiments). Scale bars, 25 μm (a–c), 10 μm (d,g), or 2.5 μm (e).

