Figure 3.
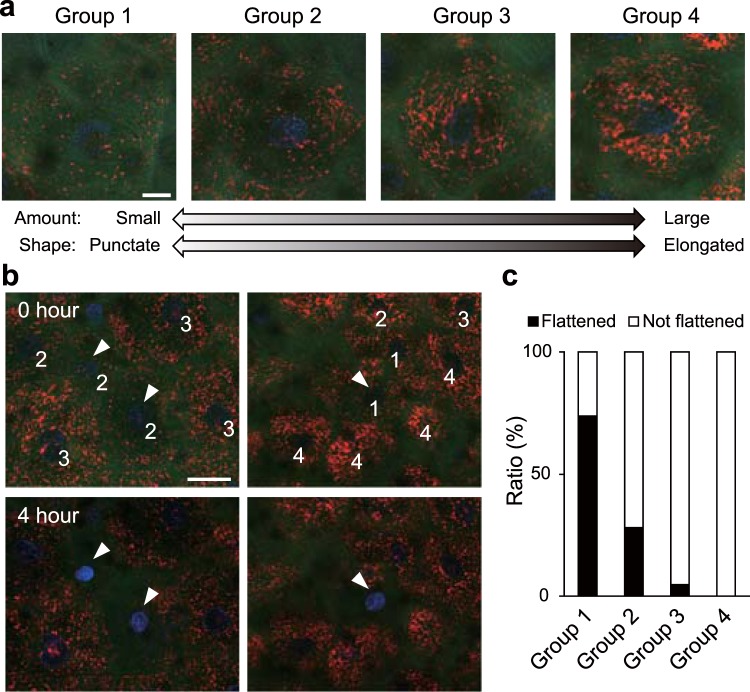
Alterations in mitochondrial condition during cornification. (a) Representative images of granular cells just below corneocytes in each group. The epidermal model was labelled with Hoechst 33258 (blue), CTG (green), and TMRE (red). Most mitochondria in group 1 had a punctate structure. The granular cells in group 2 had few mitochondria with a punctate and elongated structure. The mitochondrial structures in group 4 were comparable to those in the lower layer, while the granular cells in group 3 had fewer mitochondria than those in group 4. (b) Representative images at the start of observation (upper images) and four hours later (lower images). The numbers on the cells shows their group categorization. The arrowheads indicate flattened cells after four hours. (c) A graph of the proportion of cells that had flattened and cells that had not flattened after four hours. The data are representative of 483 cells (8 independent experiments). The ratios of the number of flattened and not flattened cells were 62:22 (group 1), 23:59 (group 2), 6:120 (group 3), and 0:191 (group 4). Scale bars, 10 μm (a) or 25 μm (b).

