Figure 4.
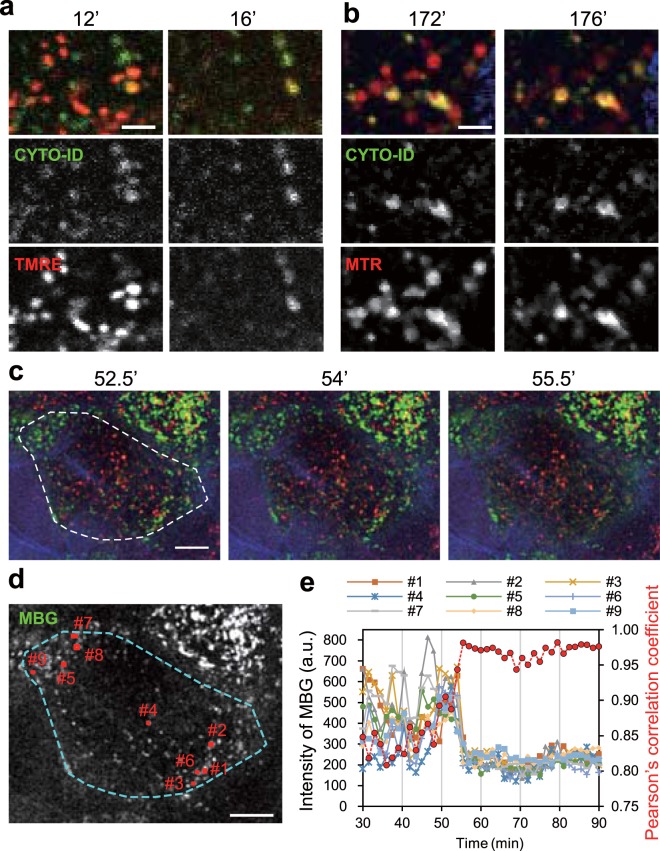
The spatiotemporal relationships among mitochondria, autophagosomes, and acidic vesicles. (a) Representative enlarged time-lapse images of granular cells labelled with Hoechst 33258 (blue), CYTO-ID (green), and TMRE (red). The upper, middle, and lower panels show merged images, CYTO-ID signals, and TMRE signals, respectively. The data are representative of 17 cells (4 experiments). (b) Representative enlarged time-lapse images of granular cells labelled with Hoechst 33258 (blue), CYTO-ID (green), and MTR (red). The upper, middle, and lower panels show merged images, CYTO-ID signals, and MTR signals, respectively. The data are representative of 32 cells (4 experiments). (c) Representative time-lapse images of granular cells labelled with CTB (blue), MBG (green), and LTR (red). A dashed line indicates the region for analysis of Pearson’s correlation coefficient in e. (d) An image of MBG signals in c at 52.5 min before the disappearance of mitochondrial signals. Small red rectangles show the mitochondrial regions analysed in e. (e) A graph of the intensity of MBG signals in each region of the rectangles (#1–9) in d and Pearson’s correlation coefficient for the colocalization of LTR signals versus time (red dashed line). The data presented in c–e are representative of 19 cells (5 experiments). Scale bar, 2.5 μm (a,b) or 10 μm (c,d).

