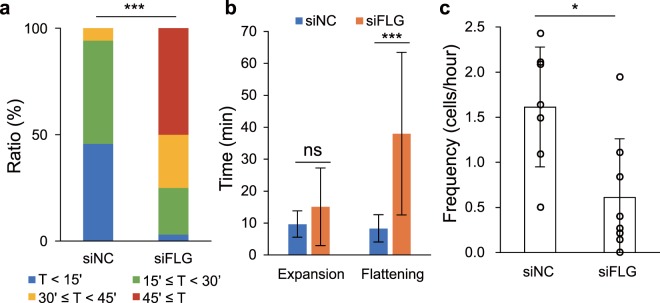
Figure 5.
Analysis of live imaging data from the FLG-KD epidermal model. (a) A graph of the time taken for morphological change to occur in the control (siNC) (n = 35) and FLG-KD models (siFLG) (n = 32). Wilcoxon rank sum test: p = 1.5 × 10⁻¹⁰. (b) A graph of the average times from the start of morphological change to expansion (shown as “Expansion”) and from expansion to flattening (shown as “Flattening”) in the control (n = 28) and FLG-KD (n = 22) models. The cells that underwent a morphological change, expansion, and flattening during observation were counted. Wilcoxon rank sum test: p = 0.18 (Expansion), p = 2.2 × 10⁻¹² (Flattening). Details are shown in Supplementary Fig. 6. (c) A graph of the number of cells that began to undergo a morphological change per hour in the control and FLG-KD models (7 (control) and 8 (FLG-KD) independent experiments). Wilcoxon rank sum test: p = 0.014. p values, *<0.05, **<0.01, ***<0.001.

