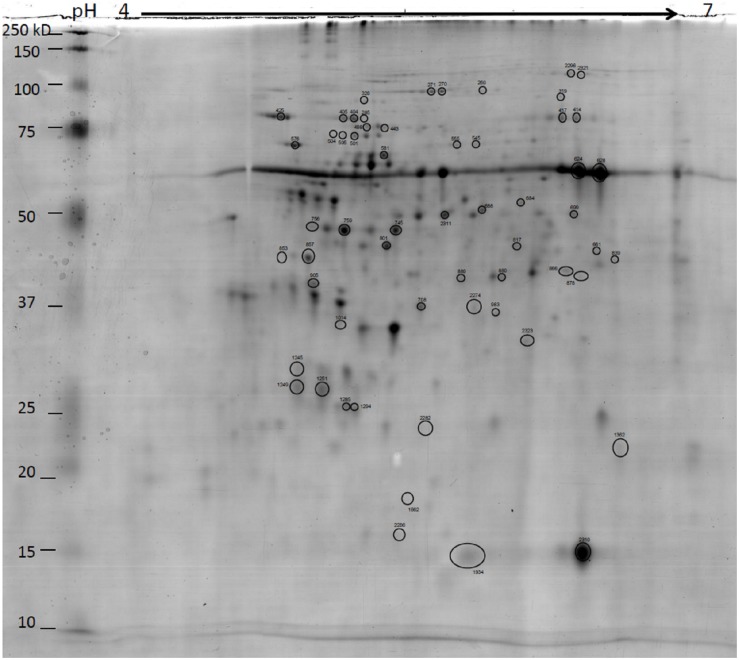
FIGURE 3.
Representative 2DE gels of coffee leaf proteins. Circled spots that significantly changed in abundance between Greenforce CuCa (G), ASM (A) and Control (C) at 3, 5, and 7 dat and 2 and 4 days after inoculation (i) with H. vastatrix (Hv) [one way ANOVA analysis was performed using a p-value < 0.05 and Fold Change > 1.5.] The proteins were successfully identified by MALDI-TOF/TOF-MS (detailed information on Table 2). Gels were stained in Colloidal Coomassie Blue.

