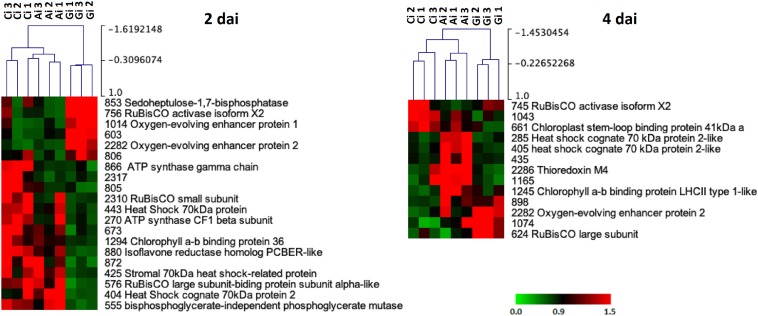
FIGURE 7.
Hierarchical cluster analysis of the proteins that significantly changed in abundance (p-value < 0.05) between PRI treatments followed by H. vastatrix infection, at 2 and 4 days after inoculation (i): Greenforce CuCa (Gi), ASM (Ai), and Control (Ci). The signals are shown in a red-green color scale, from a gradient of red (higher expression) to green (lower expression).

