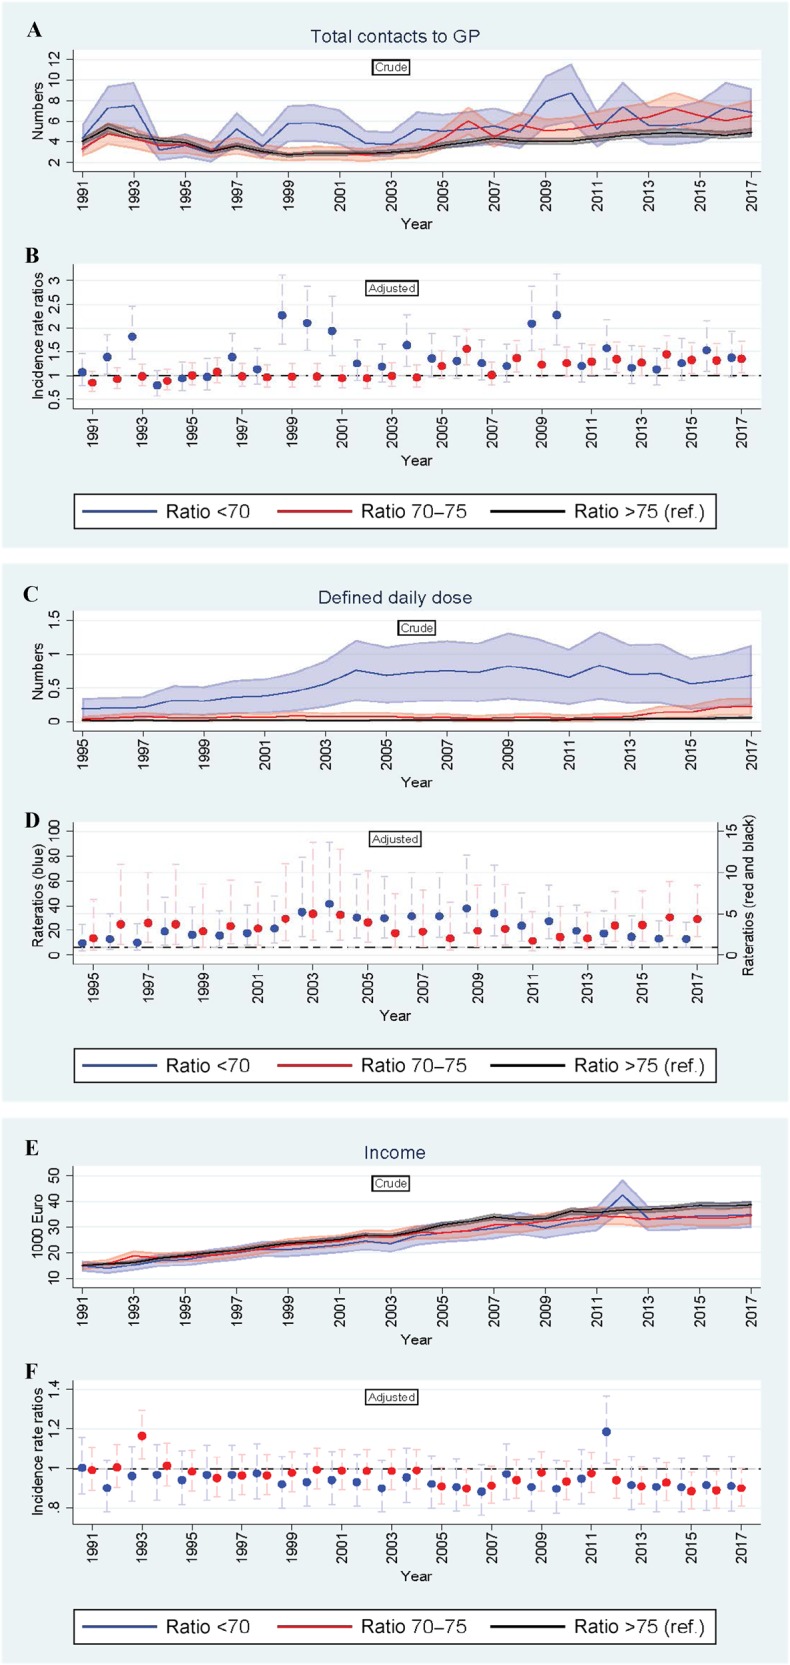
Fig. 1. Mean numbers and Incidence rate ratios 1991–2017.

a–f The figure consists of six graphs showing the descriptive correlation between lung function at baseline (exposure) and development of medical health condition on different parameters. Outcomes in 1-year intervals are: number of contacts to general practitioner from 1991 to 2017 (panel a, b), redeemed prescriptions for respiratory medicine from 1995 to 2017 (panel c, d) and income level from 1991 to 2017 (panel e, f). X-axis: time (years), Y-axis: outcome (numbers). Unadjusted, crude mean numbers are shown in the top panel and adjusted IRRs (95% CI) in the bottom panels. Group three (FEV1/FVC>75) is the reference group and the regressions is adjusted for sex, age and smoking status. GP general practitioner, FEV1 forced expiratory volume in 1s, FVC forced vital capacity.
