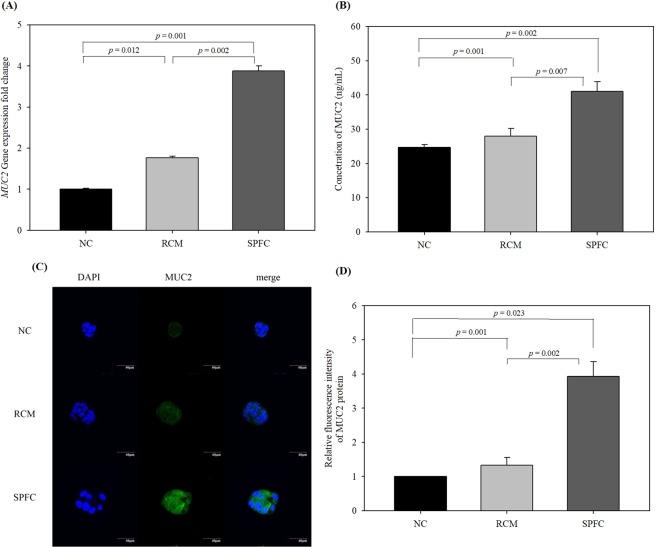
Figure 2.
mRNA and protein expression levels of MUC2 in SPFC-treated LS 174T cells. The cells were treated with RCM or SPFC (10%, v/v) and incubated for 48 h. (A) mRNA expression level determined by qPCR; (B) MUC2 concentration in the supernatant of the cell culture determined by ELISA; (C) images of immunofluorescence-stained cells; (D) quantification results of MUC2 production by immunocytochemistry. mRNA expression levels were normalized to the reference gene GAPDH. Each value indicates the mean ± SD of three independent experiments performed in triplicate. The significance of the differences was determined by the Student’s t-test. NC: the negative control group; RCM: the reinforced clostridial medium-treated group; SPFC: the supernatant of P. freudenreichii culture-treated group.

