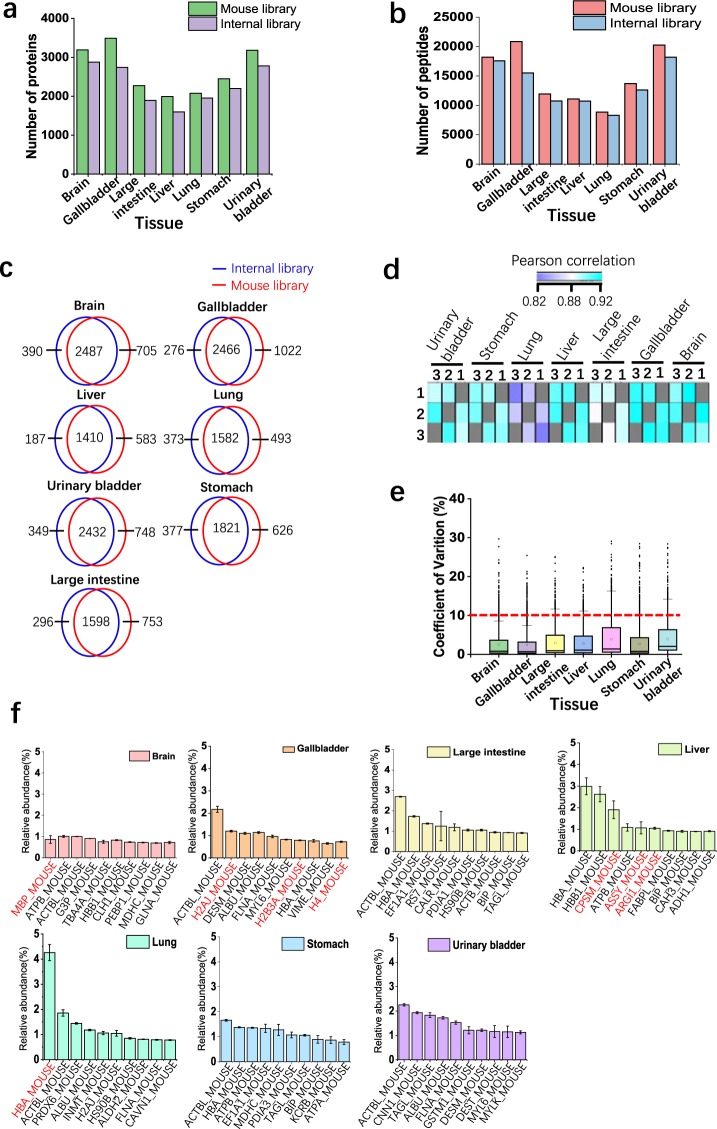
Fig. 3.
Analyzing tissue SWATH-MS data using the murine spectral library. (a) The numbers of quantified proteins at 1% global protein FDR in three technical replicates in seven tissue datasets. The mouse library and the internal libraries were used to analyze SWATH-MS data. (b) The numbers of quantified peptides at 1% global protein FDR in three technical replicates in seven tissue datasets. (c) Pearson correlation of protein intensities identified in two samples. (d) CV of log2-transformed intensities of quantified proteins in three replicates using L929 library. (e) The proteins with the top ten highest abundances in each tissue. The protein intensity was normalized with the sum of all protein intensities, and top ten proteins were shown. The tissue-function related proteins were labelled in red (protein entry names are from UniProt/SwissProt database).

